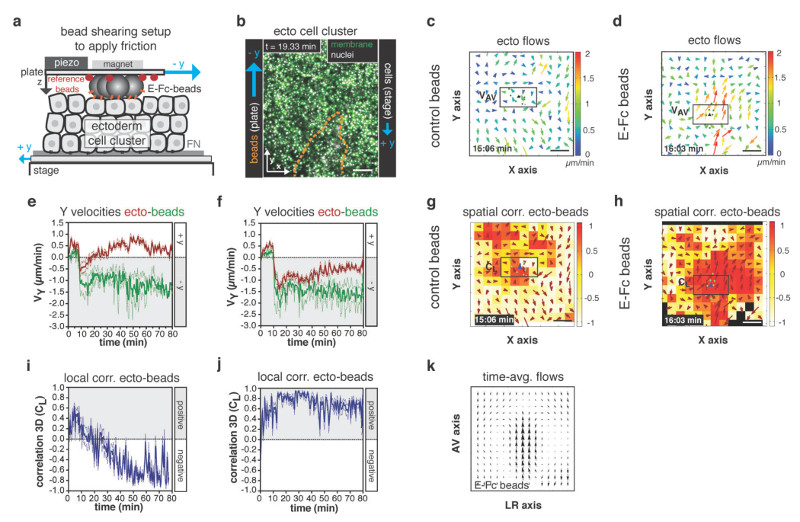
Figure 7. E-cadherin-mediated friction is sufficient to reorient neurectoderm (ecto) cell movements in vitro.
(a) Illustration of parallel plate setup for application of friction on ecto cells in vitro; uncoated control or coated with E-cadherin/Fc (E-Fc) polystyrene beads were sheared uniaxial (- y) over a cluster of opposing moving ecto cells, (+ y) to create friction; fluorescent reference beads (red) absorbed to top plate were used to track position and movement of adjacent polystyrene beads; E-cadherin receptors (orange) mediating friction indicated.
(b) Maximum projection confocal image of ecto cell cluster expressing GPI-GFP (membrane, green) and H2A-mCherry (nuclei, white) plated onto a fibronectin-coated dish; directions of cell/stage movement (+y; velocity ~0.5µm/min) and E-Fc-coated beads/top plate movement (-y; velocity ~1.5µm/min) indicated; position of cluster of beads above ecto cells outlined (orange dashed line).
(c,d) 2D tissue flow map indicating average velocities of ecto cell movements along the Y (VY) and X (VX) axis after application of friction using control (c) or E-Fc-coated (d) beads at a representative time point; local average ecto velocities indicated and color-coded ranging from 0 (blue) to 2 (red) µm/min; positions of leading edge polystyrene beads are marked by green dots; boxed area was used for measurements in (e,f).
(e,f) Mean velocities along the Y axis (Vy) of leading edge control (e; n=3 experiments) or E-Fc-coated (f; n=3 experiments) beads (green) and adjacent ecto cells (boxed area in c,d; red curve) plotted before (t = 0-10min) and after (t = 10-80min) application of friction; error bars, s.e.m.
(g,h) 3D directional correlation between ecto cells and adjacent control (g) or E-Fc-coated beads (h) at a representative time point; correlation color-coded ranging from 1 (red, highest) to -1 (white, lowest); red arrows indicate local averaged ecto velocities; position of all/leading edge ppl cells marked by white/green dots; blue arrowhead indicates average velocity of ppl leading edge cells; boxed area was used for measurements in (i,j).
(i,j) 3D average directional correlation between ecto cells (boxed area in g,h) and leading edge control (i; n=3 experiments) or E-Fc-coated beads (j; n=3 experiments) before (t = 0-10min) and after (t = 10-80min) application of friction.
(k) Time-averaged tissue flow map (over 70 (10-80) min from 3 experiments) of ecto cell movements along the y (Vy) and x (Vx) axis after application of friction using E-Fc-coated beads; error bars, s.e.m. Scale bars, 100µm (b,c,d,g,h).

