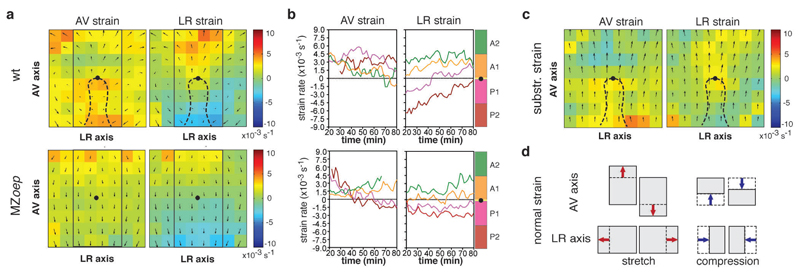
Figure 8. Friction forces trigger tissue deformations within the neurectoderm (ecto).
(a) Ecto tissue deformations along the AV and LR axes of wt (upper panels; n=3) and MZoep (lower panels; n=3) embryos plotted as time-averaged strain values for each domain (50x50µm); average normal strain rate is color coded according to amount of stretch [minimum green (0) to maximum red (10 x10-3s-1)] or compression [minimum green (0) to maximum blue (-10 x10-3s-1)]; tissue flows of ecto are indicated as time-averaged velocities; dashed line indicates ppl position and black dot marks ppl leading edge as reference point in wt and MZoep; rectangle outlines area used for defining sectors along the AV axis in (b).
(b) Mean normal strain rates of ecto tissue along the AV (left panels) and LR (right panels) axes of wt (upper panels; n=3 embryos) and MZoep (lower panels; n=3 embryos) embryos in defined sectors (100x200µm) of the ecto (A1 and A2 anterior and P1 and P2 posterior of ppl leading edge; for detailed description refer to Supplementary Fig. 1e) as a function of time during gastrulation (plotted from 6.3-7.3 in 10min intervals); amount of stretch/compression within each sector is plotted along the y-axis;
(c) Ecto tissue strain rate maps derived by subtraction of AV (left panel) and LR (right panel) time-averaged strain values of wt from MZoep mutant embryos (n=3 embryos); color-code as in (a); tissue flows of ecto are indicated as time-averaged velocities; black dot marks ppl leading edge as reference point.
(d) Illustration of kind and direction of tissue deformation in the ecto derived from normal strain; arrows indicate direction of stretch or compression of a tissue domain along the AV and LR axes dependent on the direction and magnitude of ecto movements.

