Figure 7.
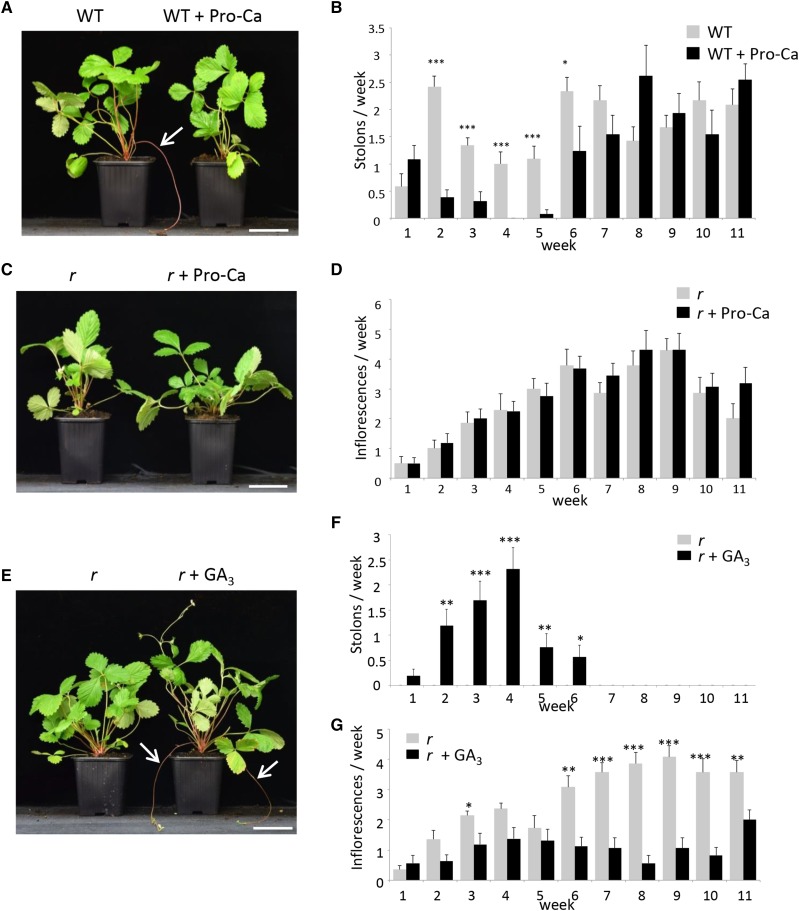
Treatment of the Wild Type and the r Mutant with GA Inhibitor (Pro-Ca) and Bioactive GA.
(A) and (B) Treatment of the wild type genotype with Pro-Ca.
(A) Representative image showing stolon production (white arrow) on week 3. Bar = 6.5 cm.
(B) Pro-Ca treatment significantly reduces the number of stolons produced between weeks 2 and 6. n = 13 or 12 ± se.
(C) and (D) Treatment of the r mutant with Pro-Ca.
(C) Representative image on week 3. Bar = 6.5 cm.
(D) Pro-Ca treatment has no effect on the number of inflorescences. n = 16 or 14 ± se.
(E) to (G) Treatment with bioactive GA restores runnering in the r mutant.
(E) Representative image showing stolon production (white arrows) in the r mutant after GA3 treatment on week 3. Bar = 6.5 cm.
(F) Quantification of stolon production after GA3 treatment. Mock-treated plants never produce stolon.
(G) Quantification of inflorescence production after GA3 treatment. n = 16 and 14 for GA-treated and mock-treated plants ± se. Treatments were performed twice a week during the first two weeks (last treatment on week 1). Asterisks indicate significant differences (Mann-Whitney test): *P < 0.05, **P < 0.01, and ***P < 0.001.

