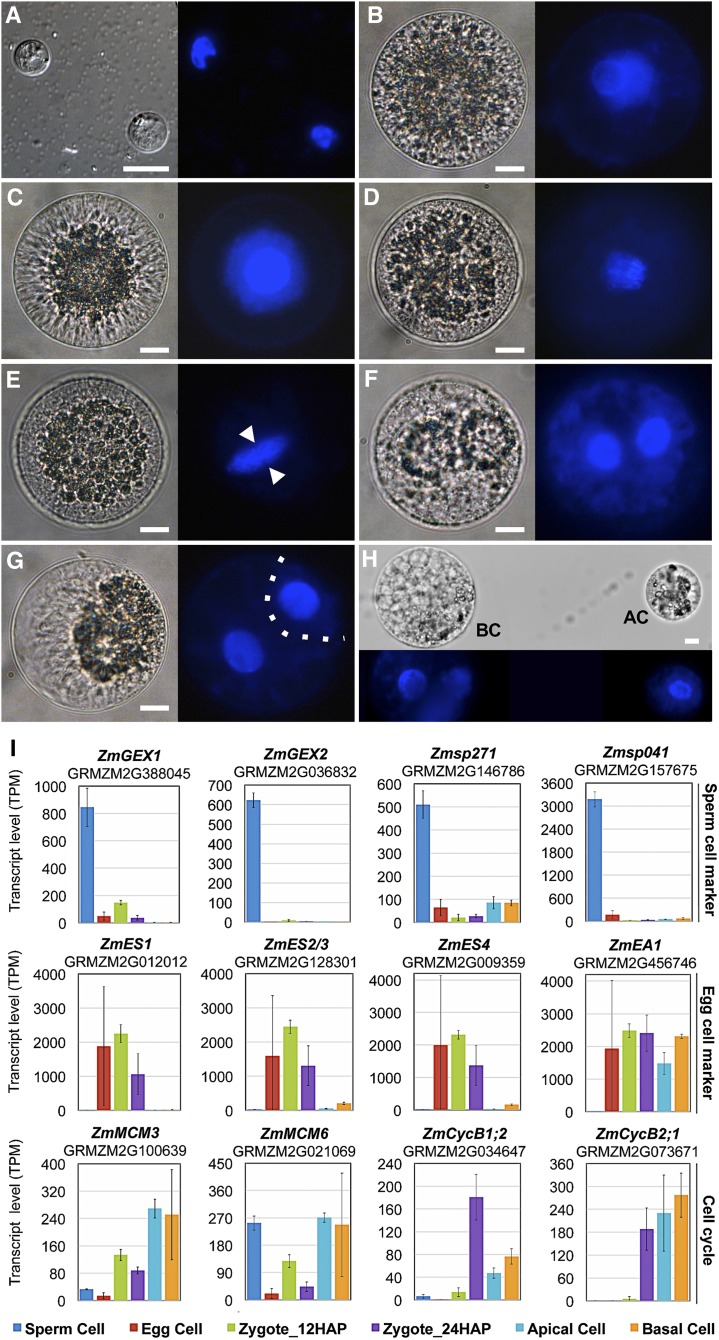
Figure 1.
Time Course of Zygote Development and Validation of RNA-Seq Data.
(A) Sperm cells.
(B) Egg cell.
(C) Zygote at 24 HAP.
(D) Zygote at 30 HAP at anaphase.
(E) Zygote at 35 HAP at telophase. Arrowheads indicate phragmoplast between daughter chromosome sets.
(F) Zygote at 43 HAP during ACD.
(G) Zygote at 48 HAP. Cytokinesis is completed. Dotted line indicates the cell division plane.
(H) Apical (AC) and basal cell (BC) have been separated at 54 HAP. Bright-field microscopy images are shown on the left and UV images of DAPI-stained cells on the right. Bars = 10 μm.
(I) Validation of RNA-seq data with known genes, as indicated. Top row: Genes preferentially expressed in sperm cells. Middle row: Genes highly expressed in egg cells and downregulated after fertilization. Bottom row: Expression of cell cycle regulators. Transcript levels are shown as TPM values (means ± sd) of three biological replicates.

