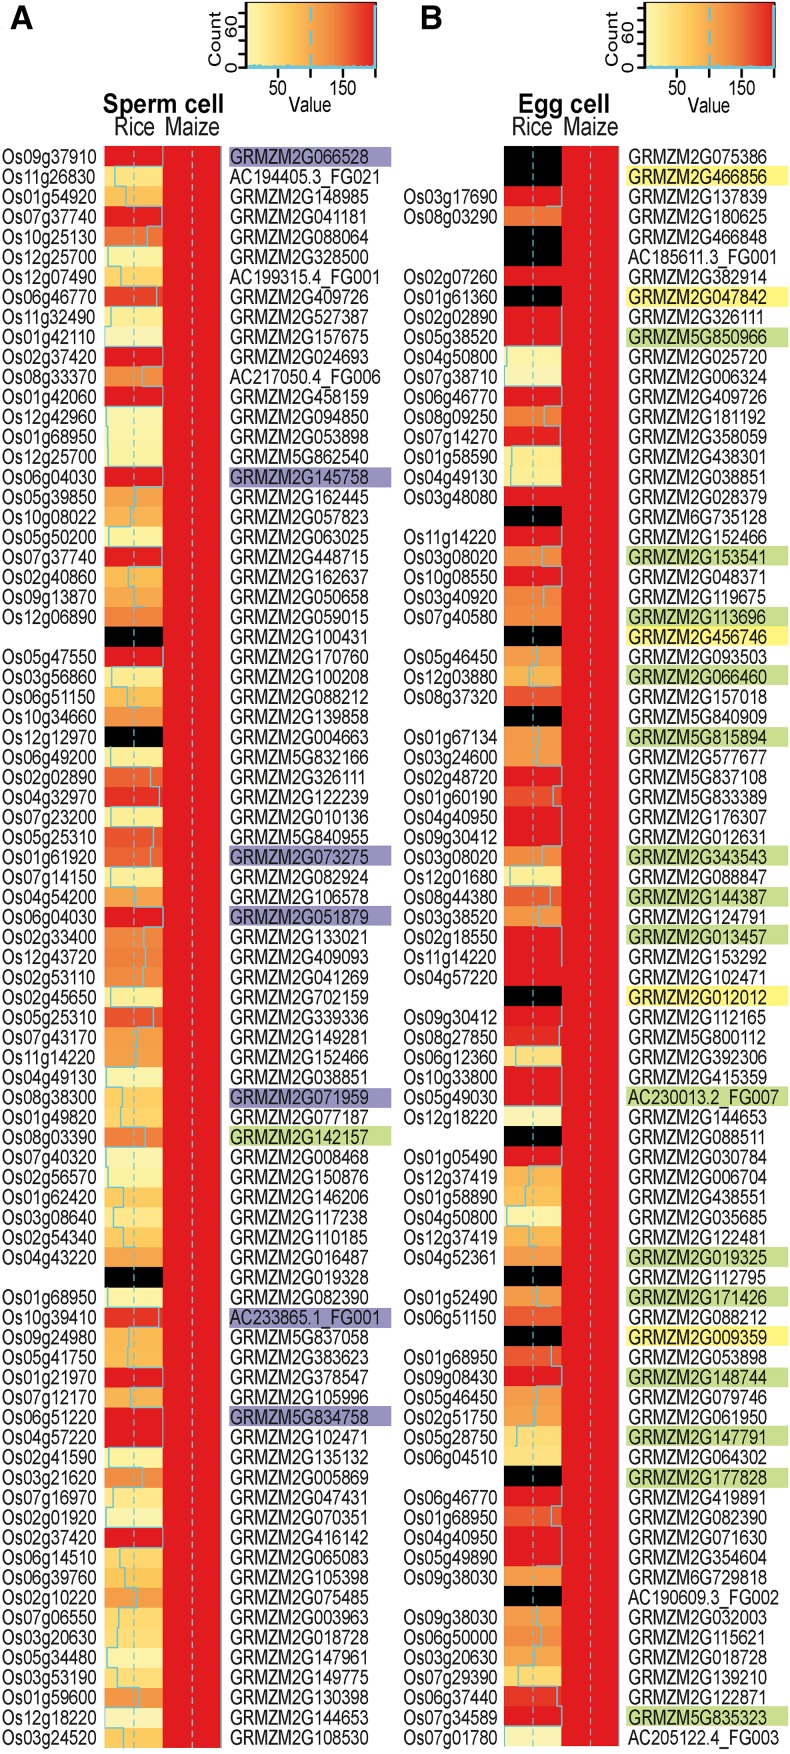
Figure 2.
Heat Map Showing a Comparison of the 80 Most Highly Expressed Genes in Maize Gametes and Their Predicted Orthologs in the Corresponding Rice Gametes.
TOP80 most highly expressed genes in maize sperm cells (A) and TOP80 genes in maize egg cells (B). Rice and maize gene expression values (TPM) were square root transformed and classified into 200 expression bins using the 99th percentile of the data as the maximum value. Note that all maize genes shown are in the bin with maximum expression and are therefore represented by red bars. Plastid genomes were excluded, as they showed overshooting of expression in the rice data. Nonexpressed genes in the rice data and genes lacking a clear homolog are marked by black bars. Orthologous gene information is based on the EnsemblPlants Compara database, The Rice Genome Annotation Project (RGAP), and orthologs from RGAP based on OrthoMCL. Maize genes encoding histones and high-mobility group genes are shaded in purple, proteins involved in translation are in green, and EA1-box proteins and predicted secreted CRPs are in yellow. Proteins were classified according to InterPro.

