Figure 5.
CCA1 Binds the Promoter of GI in Vitro and in Vivo.
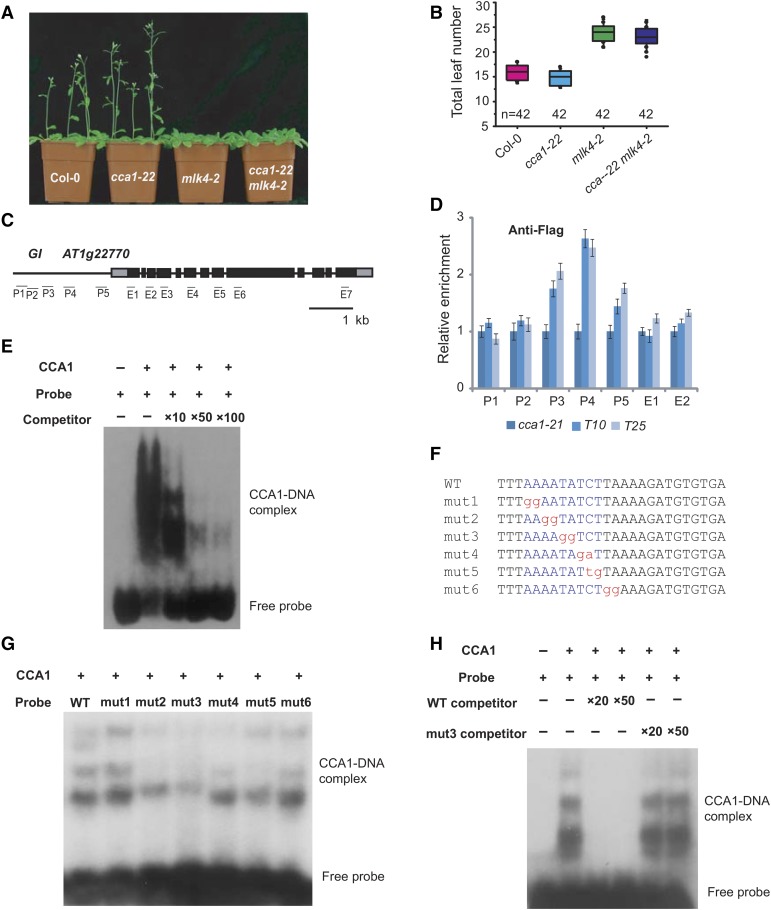
(A) Representative images of 30-d-old Col-0, cca1-22, mlk4-2, and the cca1-22 mLk4-2 double mutant under a LD photoperiod.
(B) The total leaf number of Col-0, cca1-22, mlk4-2, and cca1-22 mLk4-2 plants under LD. Flowering time was assessed by counting the number of rosette leaves and cauline leaves at bolting under LD. Values shown are mean ± sd of total leaves; 42 plants were scored for each line.
(C) Gene structure of GI, indicating exons (boxes) and introns (lines). The locations of the gene regions analyzed by ChIP-PCR are marked. P1 to P5 indicate regions in the GI promoter, and E1 to E7 indicate the coding region.
(D) The amounts of CCA1 at different regions of GI were determined using ChIP-PCR. T10 and T25 are shown in Supplemental Figure 6. The y axis denotes enrichment relative to UBIQUITIN. Experiments were repeated at least three times, and the data from the representative experiments shown are presented as means ± se, n = 3 replicates.
(E) Gel shift assay with CCA1 and fragments of the GI promoter region. The binding ability of CCA1 to fragments of the GI promoter (indicated in Supplemental Figure 7) labeled with 32P was assessed, and this binding specificity was tested by adding unlabeled competitor probe.
(F) The sequences of probes used for EMSA. The conserved motif, AAAATATCT, is marked in blue, and the mutated nucleotides are marked in red, lowercase letters.
(G) and (H) Gel shift assay with CCA1 and different probes. The binding ability of CCA1 to different mutated probes labeled with 32P was assessed, and this binding specificity was tested by adding unlabeled wild-type competitor probe or mutated probe 3.

