Figure 6.
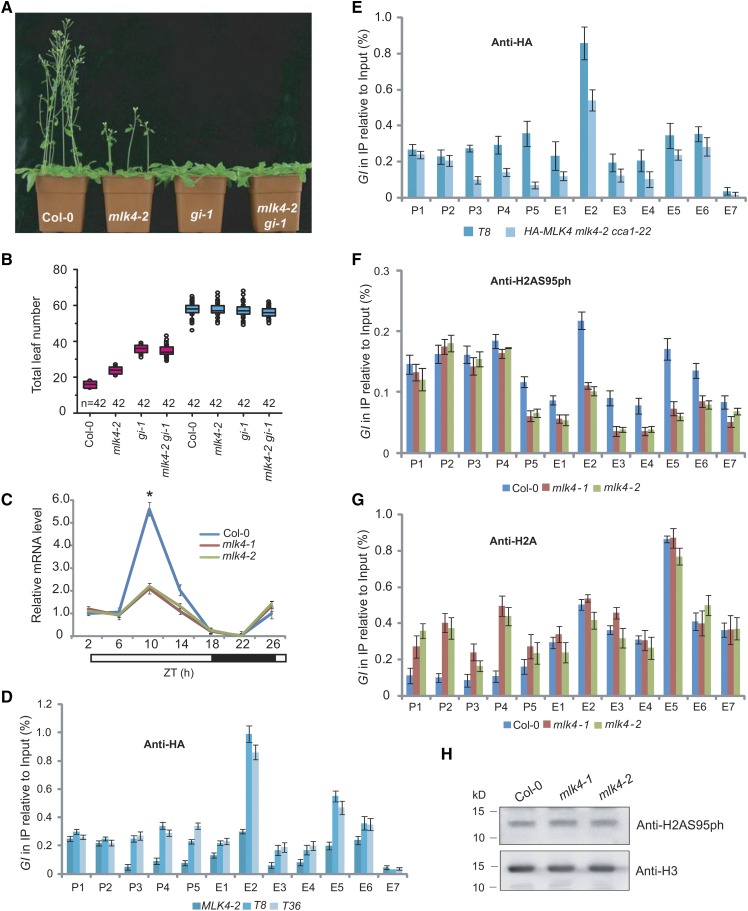
MLK4 Is Required for H2A Serine 95 Phosphorylation at GI.
(A) Representative images of 30-d-old Col-0, mlk4-2, gi-1, and the mlk4-2 gi-1 double mutant under a LD photoperiod.
(B) The total leaf number of Col-0, mlk4-2, gi-1, and mlk4-2 gi-1 mutants under LD and SD. Flowering time was assessed by counting the number of rosette leaves and cauline leaves at bolting under LD and SD. Values shown are mean ± sd of total leaves; 42 plants were scored for each line.
(C) The relative mRNA levels of GI were determined in Col-0 and the mlk4 mutants. The black bar indicates the dark period, and the white bars indicate the light periods. ZT, Zeitgeber time. Experiments were repeated at least three times, and the representative experiments shown indicate the mean ± se, n = 3 replicates. Asterisks indicate significant difference from Col-0 using Student’s t test (P < 0.05).
(D) The amounts of MLK4 at different regions of GI were determined in mlk4-2 complemented lines T8 and T36 (see Supplemental Figure 1).
(E) The amounts of MLK4 in different regions of GI were determined in T8 and HA-MLK4 mLk4-2 cca1-22.
(F) The amounts of H2AS95ph at different regions of GI were tested in the wild type and mlk4 mutants.
(G) The amounts of H2A in different regions of GI were tested in the wild type and mlk4 mutants.
From (D) to (G), the y axis denotes enrichment relative to input. Experiments were repeated at least three times, and the data from representative experiments shown are presented as means ± se, n = 3 replicates. P1 to P5 indicate regions in the GI promoter, and E1 to E7 indicate the coding region (see Figure 5C).
(H) The global H2AS95ph levels were measured in the wild type and mlk4 mutants. H3 is shown as an internal control. The molecular weight is indicated on the left; the sizes of the bands are as expected. Experiments were repeated at least three times, and representative experiments are shown.

