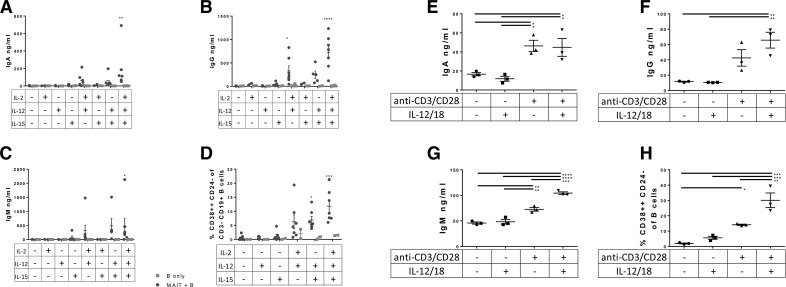
Figure 4. Induction of antibody production and plasmablast differentiation by TCR- and cytokine-stimulated MAIT cells.
(A–D) We cocultured Vα7.2+CD161++ MAIT cells and B cells from different subjects in the presence of several combinations of IL-2, -12, and -15 for 7 d and measured antibody levels and B cell phenotype. Data are means ± sem, and were analyzed by 2-way ANOVA, with Fisher’s LSD test, comparing MAIT+B cells with B cells only. We also cultured Vα7.2+CD161++ T cells for 24 h with plate-bound anti-CD3/CD28 stimulation and/or recombinant IL-12/18, and supernatant with IL-12/18 blocking antibodies was applied to B cells for 7 d, followed by ELISA (E–G) and flow cytometry (H) for B cell phenotype. Data shown are mean ± sem, and significance was determined by 1-way ANOVA using Tukey’s multiple comparisons test. Data are representative of 2 independent experiments. *P ≤ 0.05; **P ≤ 0.01; ***P ≤ 0.001; ****P ≤ 0.00001.

