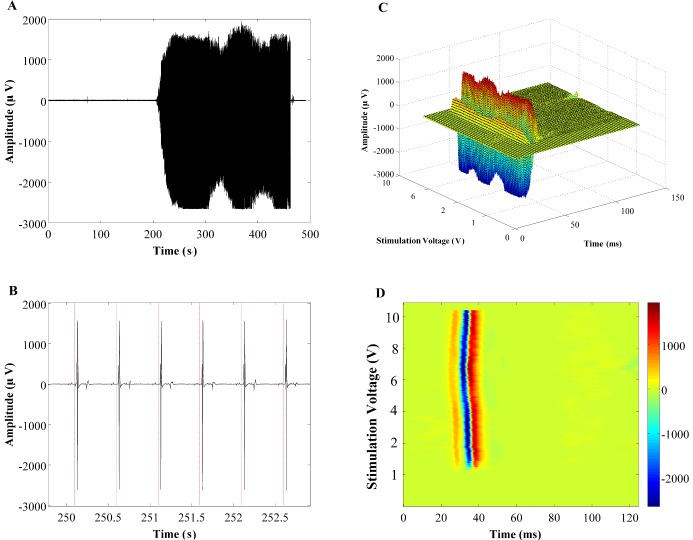
Fig 3. The steps for converting raw EMG signals into 2-D and 3-D images.
(A) Raw EMG signal, (B) Signal segmentation using stimulation time intervals, (C) Overlaying all the segments and building the 3-D graph where X-axis is the evoked potentials duration (ms), the Y-axis is the stimulation voltage (V), and the Z-axis is the amplitude of the signals (μV) and (D) Converting the 3-D graphs into 2-D images using Colormap.

