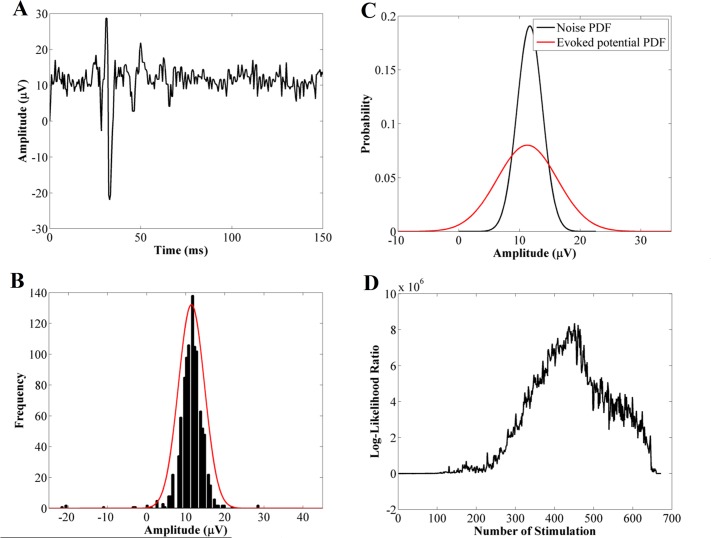
Fig 5. Calculation steps for activation detection algorithm.
(A) Sample evoked potential (one segment of the EMG signal), (B) Histogram of the sample evoked potential (black) and its estimated Gaussian distribution (red), (C) Comparing the Gaussian pdf of evoked potential signal (red) to pdf of background noise (black), (D) Plotting the calculated LLR for all segments of the EMG signal and detect the activation threshold (arrow).

