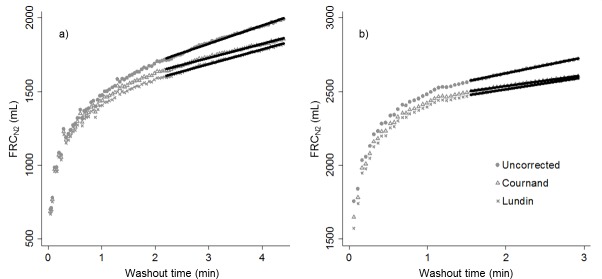
Fig 4.
Representative examples of FRCN2 plotted against washout time in a) a healthy subject and b) a patient with CF. Application of the Cournand and Lundin tissue N2 excretion equations resulted in a less pronounced increase in the calculation of FRCN2 over the course of the washout, but a plateau was never achieved. Linear regressions of these curves over the second half of the washout are shown, demonstrating the slopes that are reported in Table 4.

