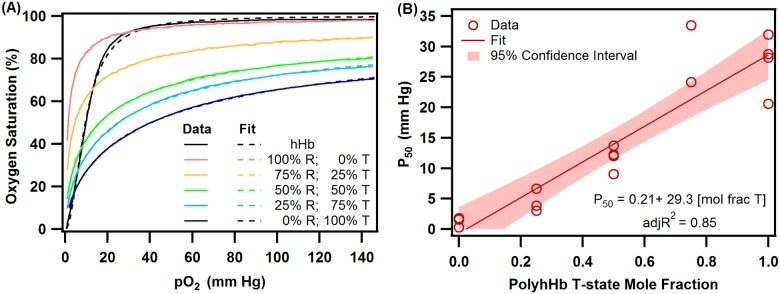
Fig 4. hHb and PolyhHb O2 equilibrium.
(A) Comparison of O2 equilibrium curves of hHb, 30:1 R-state PolyhHb, 35:1 T-state PolyhHb, and mixtures of 35:1 T-state PolyhHb and 30:1 R-state PolyhHb at various molar fractions of T: 0.75,0.5 and 0.25. Dots represent experimental data and the corresponding solid lines of the same color represent curve fits. (B) Dependence of P50 on mole fraction of 35:1 T-state PolyhHb to 30:1 R-state PolyhHb. The data were fit to a linear function using JMP 9.2.

