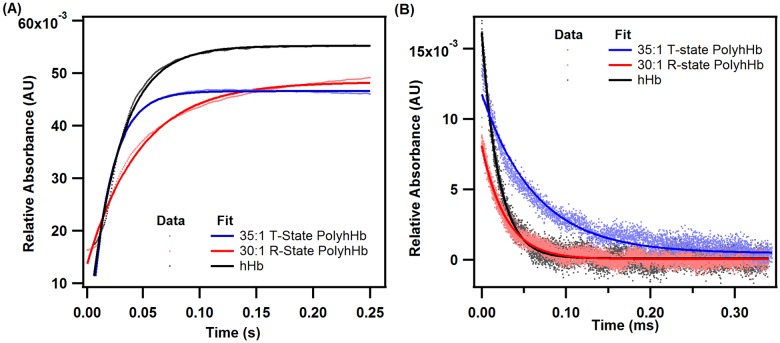
Fig 5. Deoxygenation and oxygenation kinetic time courses for hHb, T-state PolyhHb and R-state PolyhHb.
(A) Comparison of time courses for deoxygenation in the presence of 1.5 mg/mL sodium and (B) oxygenation time course facilitated by flash photolysis of hHb (red), 30:1 R-state PolyhHb (black), and 35:1 T-state PolyhHb (blue). Dots represent experimental data and the corresponding solid lines of the same color represent curve fits. The experimental data shows an average of 10–15 kinetic traces. For deoxygenation, the reactions were monitored at 437.5 nm and 20°C. For oxygenation, the reactions were monitored at 430 nm. PBS (0.1 M, pH 7.4) was used as the reaction buffer.

