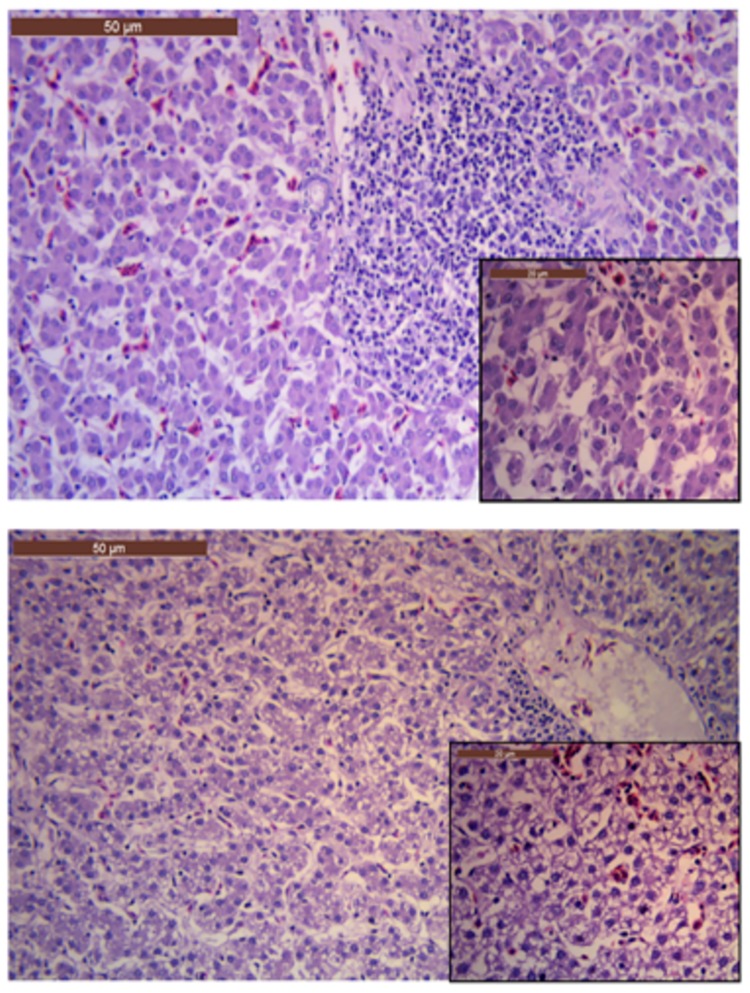
Fig 3. Liver histology.
a) Liver section from a chicken in the control group (not receiving any treatment after challenge with E. coli APEC_O2). Notice the normal and regular hepatocytes; b) Liver section from a chicken in the sertraline-treated group. Notice the major vacuolization of the hepatocytes. Each of the large images is at 20X magnification, insert in the corners are from the same image, but at 40X magnification.

