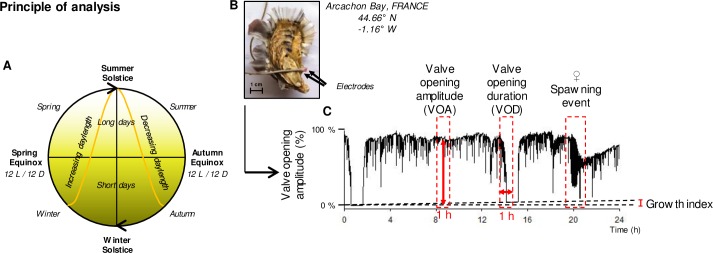
Fig 1. Principle of analysis.
(A) Schematic representation of an annual cycle where seasons are characterized by two photoperiod parameters: daylength (long or short days) and direction of daylength (increasing or decreasing daylength). L for light, D for dark. (B) Example of light electrodes of high frequency non-invasive valvometry glued to one of the triploid oysters deployed in Arcachon bay (France), for the one-year recording in the field. The black arrows indicate the position of the electrodes glued on opposite edges of the shells. Only the electrode glued on the superior valve is apparent in this picture. (C) Typical records of valve opening behavior of Crassostrea gigas during a one-day period (24 h). Four parameters were used in this study: hourly valve opening amplitude (VOA), hourly valve opening duration (VOD), spawning events and growth index corresponding to evolution of minimum valve opening over time (schematized in the one-day period in this figure).

