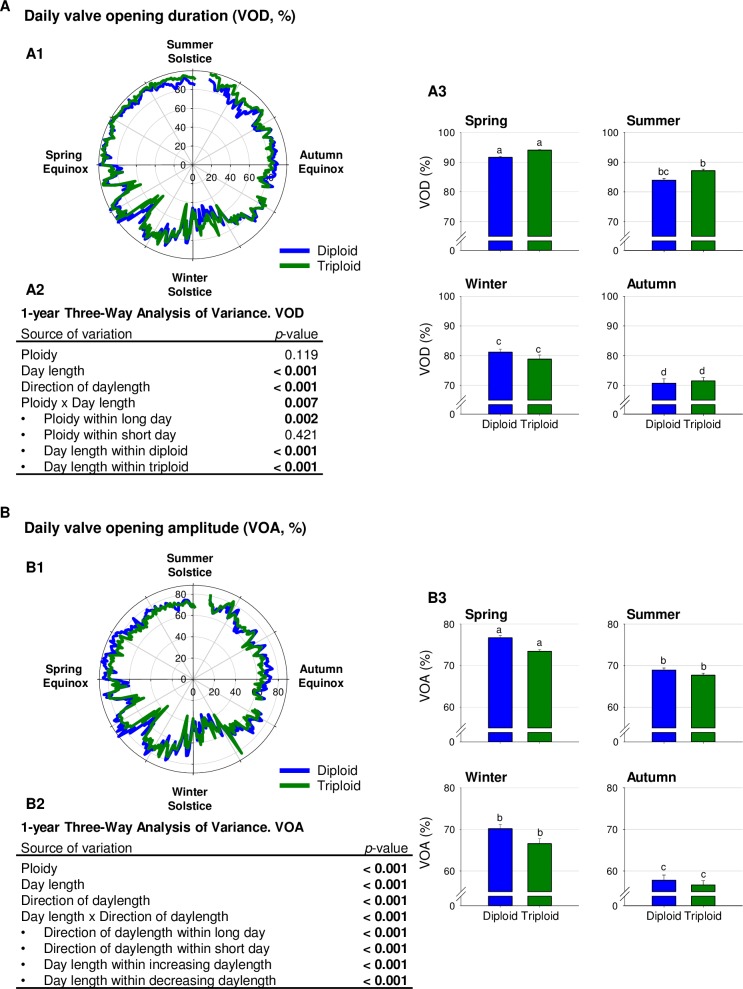
Fig 2. Valve opening duration (VOD) and amplitude (VOA).
(A) Mean daily valve opening duration (VOD, %) of diploid (blue, n = 8) and triploid (green, n = 8) oysters during the 1-year analyses. (A1) Polar plot representation of mean daily VOD. (A2) Three-way analysis of variance of VOD using ploidy (diploid or triploid), daylength (long or short days) and direction of daylength (increasing or decreasing daylength). (A3) Seasonal histograms of VOD. Letters indicate significant differences (one-way analysis of variance, p < 0.05). (B) Mean daily valve opening amplitude (VOA, %) of diploid (blue, n = 8) and triploid (green, n = 8) oysters during the 1-year analyses. (B1) Polar plot representation of VOA. (B2) Three-way analysis of variance of VOA using ploidy (diploid or triploid), daylength (long or short days) and direction of daylength (increasing or decreasing daylength). B3. Seasonal histograms of VOA. Letters indicate significant differences (one-way analysis of variance, p < 0.05).

