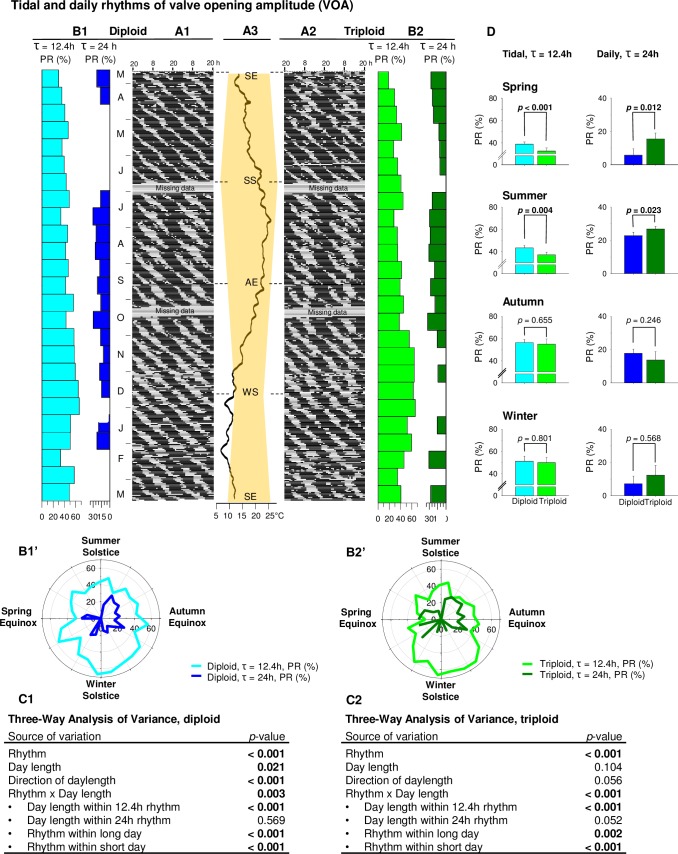
Fig 4. Tidal and circadian rhythms of valve opening amplitude (VOA).
(A) Actograms show the 1-year pattern of VOA in diploids (n = 8) (A1) and triploids (n = 8) (A2). Letters indicate either months (form March 2014 to March 2015) or equinoxes (SE: summer equinox, AE: autumn equinox) and solstices (SS: summer solstice, WS: winter solstice). (B) Percent rhythms (PR, %) of tidal (light blue for diploids or light green for triploids) and daily (dark blue for diploids or dark green for triploids) rhythms for each 15-day part of the 1-year analysis of VOA in diploid (B1) and triploid (B2) oysters. Zero values mean no significant rhythms. Same results presented as polar plots for diploid (B1’) and triploid (B2’) oysters. (C) Three-way analysis of variance on percent rhythms using rhythm (tidal or daily), daylength (long or short days) and direction of daylength (increasing or decreasing daylength) data in diploid (C1) and triploid (C2) oysters. (D) Seasonal histograms of tidal and daily percent rhythms data in diploid (blue) and triploid (green) oysters. P-values indicate differences between diploid and triploid oysters in a given season for tidal and/or daily rhythms.

