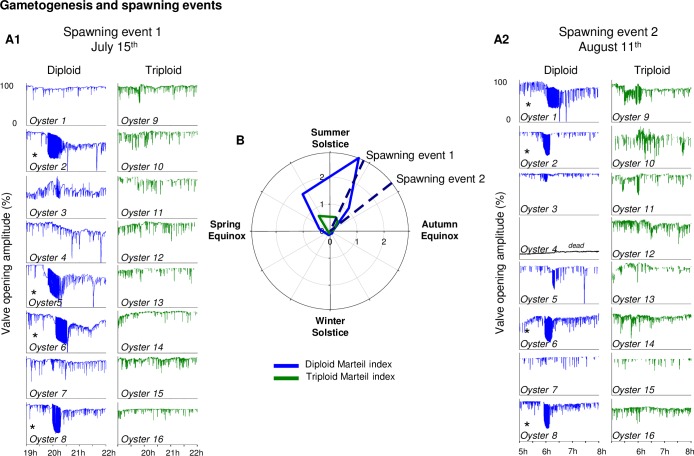
Fig 6. Gametogenesis and spawning events.
(A) In situ spawning events recording during the 1-year analysis of diploid (blue) and triploid (green) oysters. The first spawning event was recorded in July (A1), the second in August (A2). Stars (*) indicate spawning events, p-value = 0.05. (B) Mean Marteil index measured on a dedicated group of diploid (blue) and triploid (green) oysters presented on a polar plot (7 measurements, n = 10 per time and ploidy).

