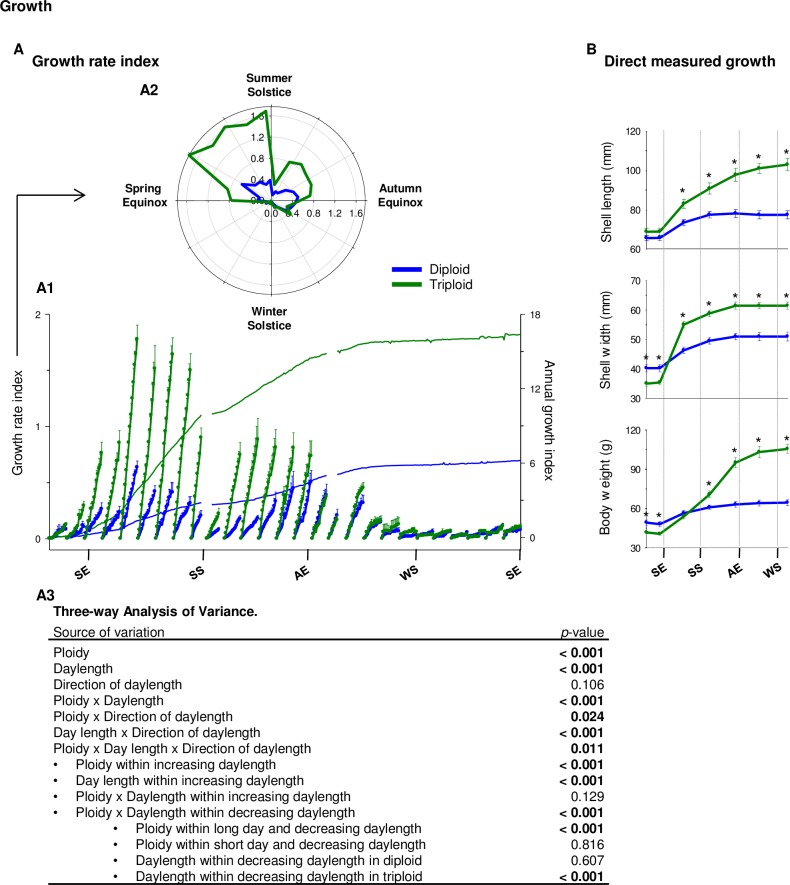
Fig 7. Growth.
(A) Mean growth rate index in diploid (blue, n = 8) and triploid (green, n = 8) oysters, measured with valvometry HFNI. (A1) One-year (right axis) and 15-day (left axis) growth rate index in diploid and triploïd oysters. The x-axis shows time, with SE for summer equinox, SS for summer solstice, AE for autumn equinox, WS for winter solstice. (A2) Fifteen-day growth rate indices presented on a polar plot. (A3) Three-way analysis of variance on 15-day growth rate index using ploidy (diploid or triploïd), daylength (long or short days) and direction of daylength (increasing or decreasing daylength). (B) Direct measured growth on a dedicated group of oysters (7 measurements, n = 16 per ploidy). Stars (*) indicate significant differences between diploid and triploid oysters at a given time point. P-value = 0.05.

