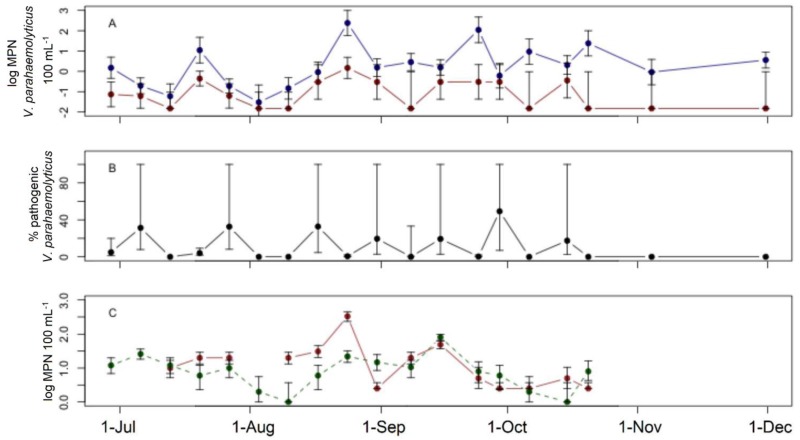
Fig 4. Field survey at Northport Harbor.
Field survey at Northport Harbor. A) Concentrations of total (blue) and pathogenic (red) V. parahaemolyticus. B) Percent of total V. parahaemolyticus identified as pathogenic. C) Concentrations of enterococci (solid) and fecal coliforms (dashed). Error bars represent 95% confidence intervals.

