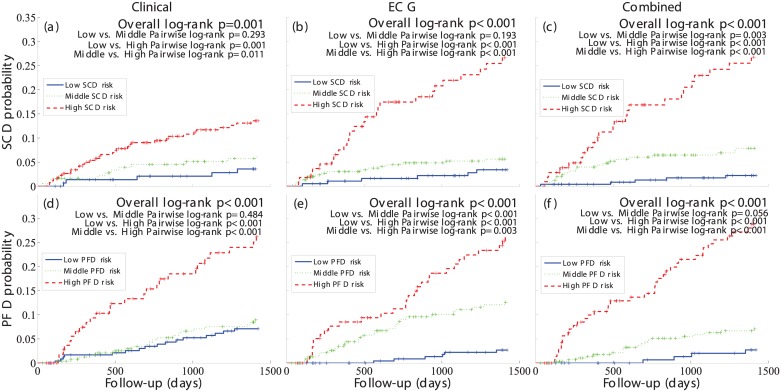
Fig 2. SCD and PFD probability curves of the clinical, ECG and combined specific risk models.
Probability curves of the three risk groups, low (solid blue), middle (dotted green) and high (dashed red) defined in the clinical (left), ECG (middle) and combined (right) specific risk models for SCD (top) and PFD (bottom).

