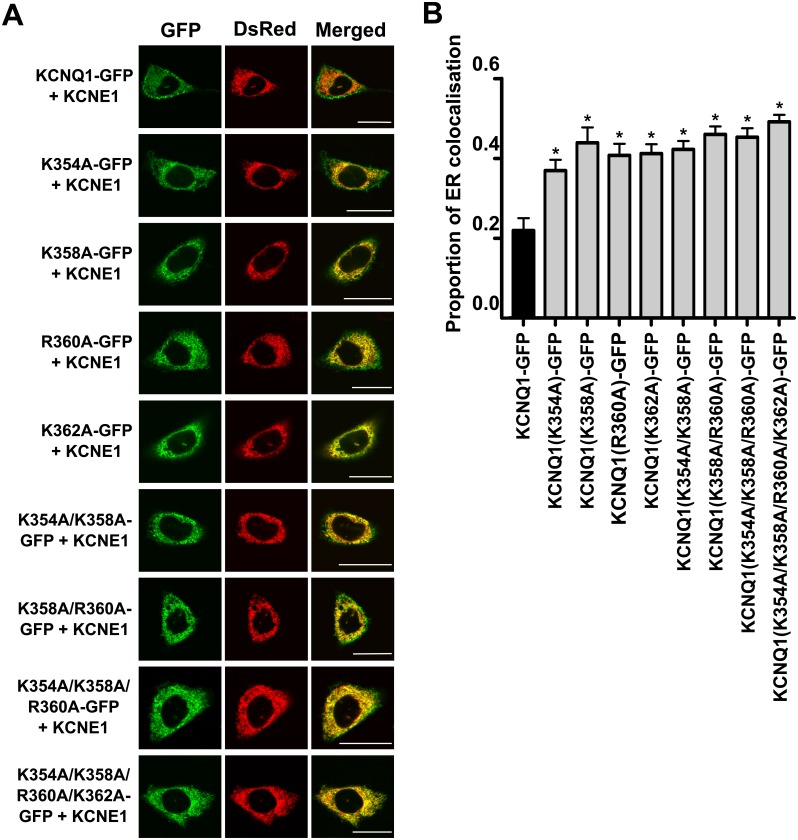
Fig 1. Charge-neutralising mutations in a PIP2-binding region in the proximal C-terminus of KCNQ1 increase retention of the channel complex in the ER.
A. Representative confocal images of the localisation of WT and mutant KCNQ1-GFP channel complexes in CHO-K1 cells. The left panel shows the GFP-tagged KCNQ1 subunit (GFP), the middle panel shows DsRed2-ER, an ER marker, and the right panel shows the merged images. In the merged image panel, the presence of yellow indicates colocalisation between KCNQ1-GFP and DsRed2-ER. Top row: WT KCNQ1-GFP with KCNE1. Lower rows: Localisation of the mutant KCNQ1 channels investigated (all n = 25, except KCNQ1(R360A-GFP), where n = 24). Scale bar indicates 20 μm. B. Quantified data showing the proportion of ER colocalisation of the WT and mutant KCNQ1-GFP subunits (in all cases KCNE1 was co-expressed). Data are presented as mean ± S.E.M. * indicates significant difference (P <0.05) from control (KCNQ1-GFP + KCNE1) value.

