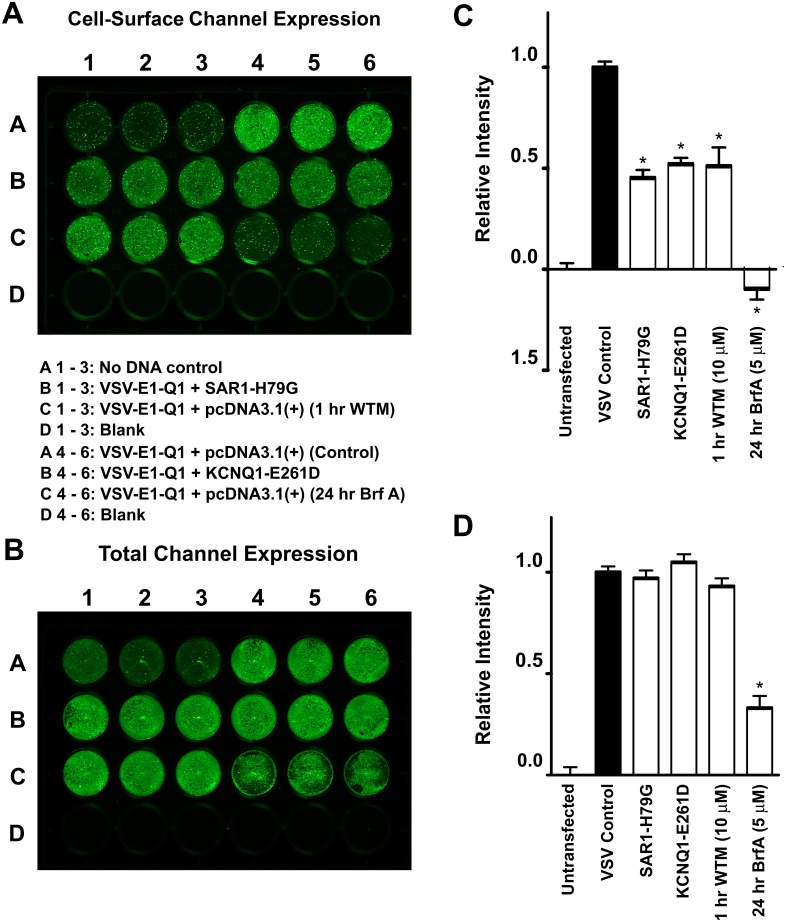
Fig 5. Measuring and manipulating the cell-surface and total expression level of KCNQ1.
A and B. Representative on-cell [37°C live] and in-cell western assays, enabling quantification of the cell-surface and total channel expression of the VSV-KCNE1-KCNQ1 (VSV-E1-Q1) channel, respectively. The VSV-E1-Q1 construct was co-expressed in HEK293 cells with either pcDNA3.1, SAR1-H79G or KCNQ1-E261D. Cells expressing VSV-E1-Q1 with pcDNA3.1 were incubated with either 10 μM wortmannin (WTM) for 1 hour or 5 μM brefeldin A (Brf A) for 24 hours before the start of the assay. Each condition was performed in triplicate. Mean data, normalised to VSV-E1-Q1 + pcDNA3.1 values (VSV Control), from three independent experiments for cell-surface and total channel expression are shown in C and D, respectively. Data presented as mean ± S.E.M. * indicates significant difference (P <0.05) from control (VSV-E1-Q1 + pcDNA3.1) value.

