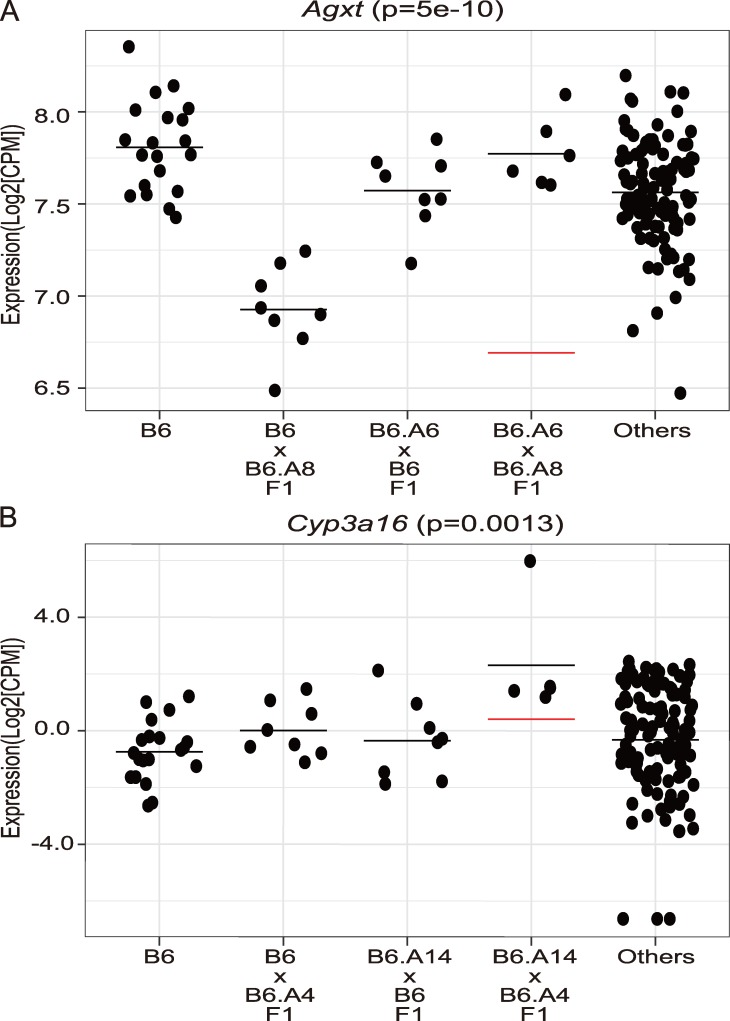
Fig 4. Examples of synergistic and antagonistic ieQTLs.
Each dot represents the gene expression data from one mouse. The horizontal bar indicates the mean value for each strain (A) An antagonistic ieQTL regulates the expression of Agxt in the liver. (B) A synergistic ieQTL regulates the expression of Cyp3a16 in the liver. The red horizontal line indicates the predicted trait level based on a model of additivity.

