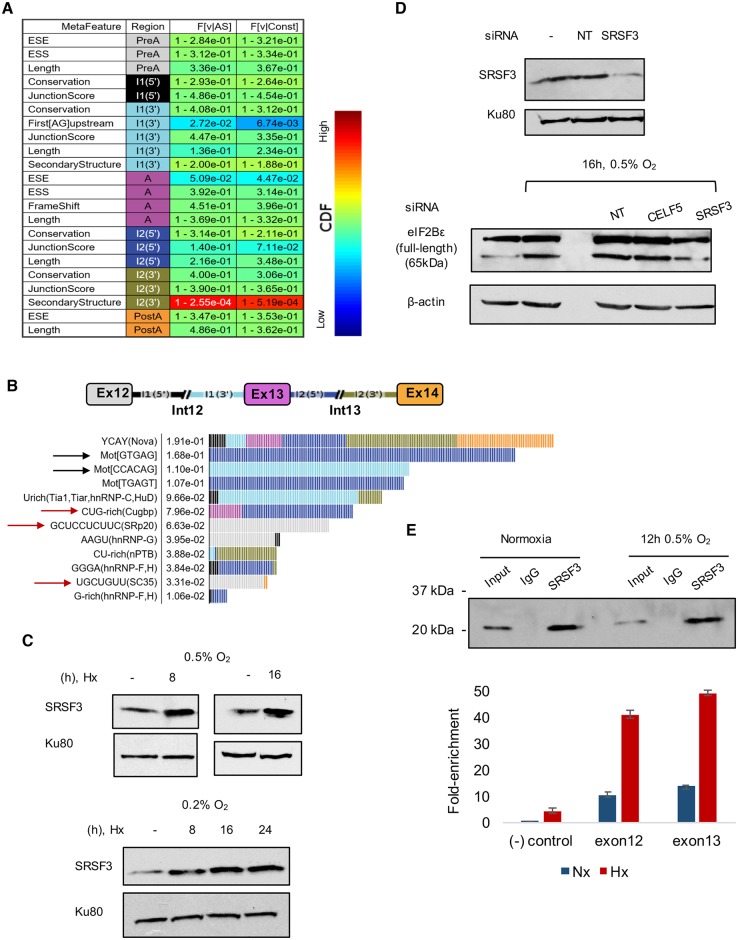
Fig 5. Analysis of RNA binding factor motifs and regulatory sequence features at the EIF2B5 intron12 locus.
(A) A nonmotif analysis of other sequence features influencing splicing of EIF2B5 exons 12–14. These were data generated using AVISPA [50]. (B) Splicing factor motifs determined to have the largest effects on regulation of the EIF2B5 exons 12–14 are shown, with color-coded gene map above and predicted regulatory sites shown below with feature effect value. Black rows highlight a predicted weak splice site before exon 13 and an alternate GTGAG splice site after exon 13. Red arrows signify splicing factors observed as hypoxia-responsive in RNA-Seq data. (C) Immunoblot of SQ20B lysates to assess expression of SRSF3 protein under hypoxia. Nx = normoxia, Hx = 16 h 0.5% O2 hypoxia. (D) Upper: Immunoblot analysis of knock-down efficiency of SRSF3 in SQ20B cells. Lower: Immunoblot of lysates collected from SQ20B cells treated with 50 nM siRNA under 16 h 0.5% O2 hypoxia. (E) Upper: Immunoblot results from immunoprecipitation of SQ20B lysate with SRSF3 antibody in normoxic and hypoxic cells. Rabbit IgG was used as a control. Lower: Reverse transcription quantitative PCR (RT-qPCR) analysis of RNA isolated from the immunoprecipitation with SRSF3 using primers for negative (-) control (a region of GAPDH predicted to contain no binding of SRSF3) and primers for the 2 exons flanking EIF2B5 intron12 predicted to have SRSF3 binding. Additional data used in the generation of this figure are included in S1 Data.

