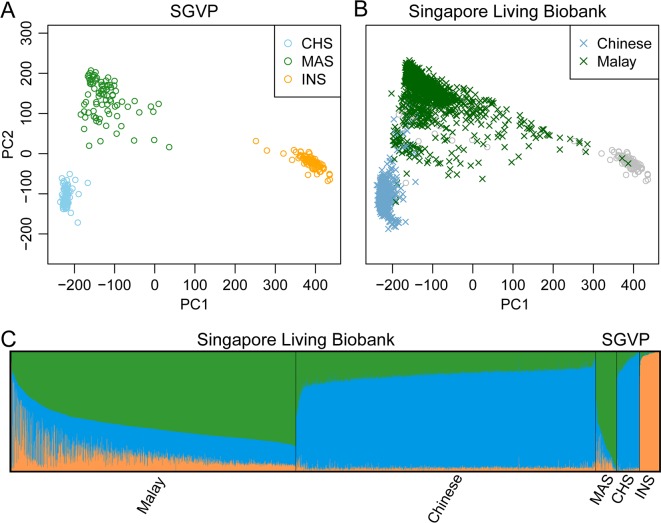
Fig 1. Population structure of 2,452 individuals in the Singapore Living Biobank Project.
(A) Reference ancestry space derived from PCA on the genotypes of Chinese (CHS), Malays (MAS) and Indians (INS) from SGVP. (B) Estimated ancestry in the SGVP reference space based on LASER analysis. Colored symbols represent study individuals of self-reported Chinese and Malays. Grey symbols represent the SGVP reference individuals. (C) Estimated admixture proportion based on supervised ADMIXTURE analysis with the SGVP data as the reference. We specified K = 3 clusters in the ADMIXTURE analysis, which represent Chinese (blue), Malay (green), and Indian (orange) ancestry components.

