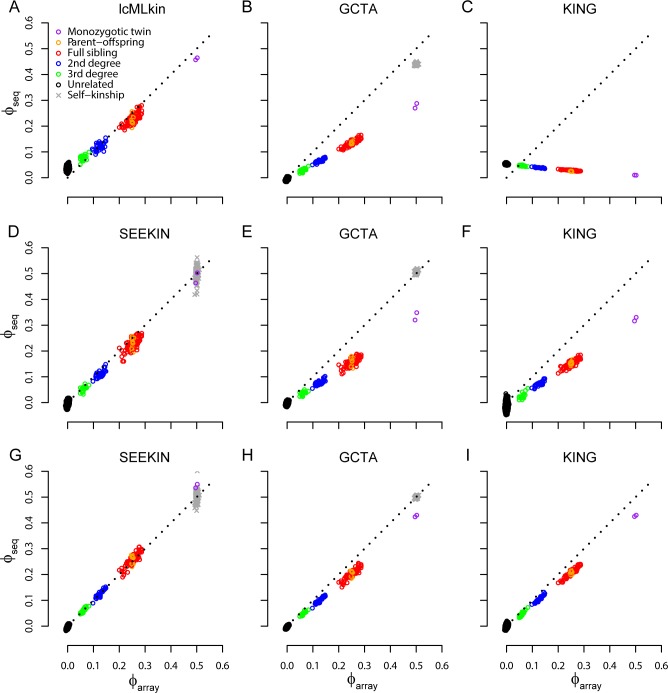
Fig 3. Performance of homogeneous kinship estimators in ~0.15X sequencing data of 254 Chinese.
In each panel, we compared sequence-based estimates (ϕseq, y-axis) with the array-based estimates from PC-Relate (ϕarray, x-axis). Colored circles represent kinship coefficients between two individuals and different types of relatedness were determined in Fig 2. Grey crosses represent self-kinship coefficients. We evaluated lcMLkin (A), GCTA (B, E, H), KING (C, F, I), and SEEKIN (D, G) using the bcftools call set (A-C), the BEAGLE call set (D-F), and the BEAGLE+1KG3 call set (G-I). Note that lcMLkin and KING do not estimate self-kinship coefficients.

