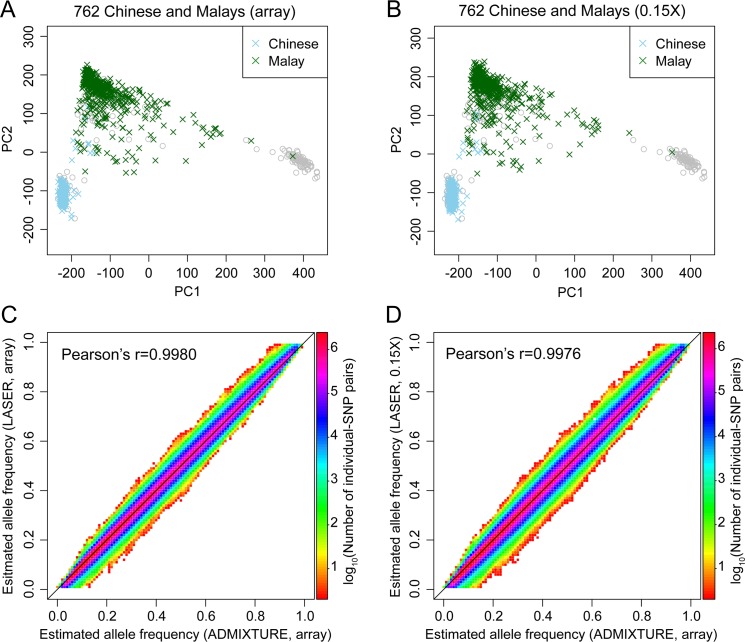
Fig 4. Ancestry and individual-specific allele frequency estimation using array data or ~0.15X sequencing data of 762 Chinese and Malays.
(A-B) LASER ancestry estimates based on array genotypes across 435,314 SNPs overlapping with the SGVP reference dataset (A) or ~0.15X sequence reads scattering genome-wide (B). Colored symbols represent study individuals and grey symbols represent the SGVP reference individuals. The Procrustes similarity between (A) and (B) is t0 = 0.9976 for 762 study individuals. (C-D) Comparison of individual-specific allele frequencies derived from LASER analysis of either array data (C) or ~0.15X sequencing data (D) to the gold standard based on ADMIXTURE analysis of array data. The two-way allele frequency space is evenly into 100×100 grids and the number of data points within each grid is color-coded according to the logarithmic scale in the color bar. The Pearson correlation is r = 0.9980 across all data points in (C) and is r = 0.9976 across all data points in (D).

