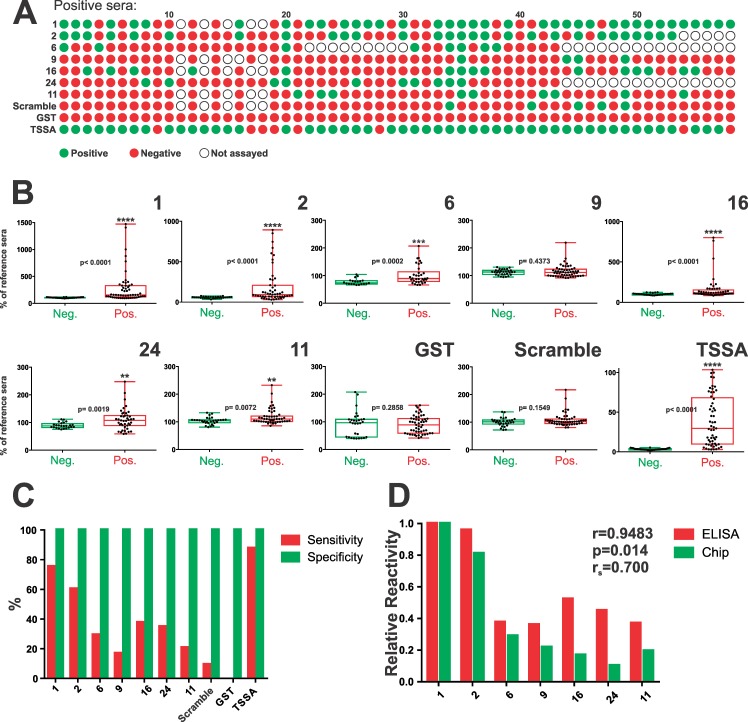
Fig 5. Serological validation of prioritized MASP motifs.
A) Complete profile of recognition of our panel of positive serum samples (n = 58) towards MASP antigenic motifs. Cutoff-defined true positive and negative results are indicated in green and red, respectively. TSSA (Trypomastigote Small Surface Antigen) was used as positive control whereas a scrambled TSSA peptide and GST (Glutathione S-transferase) were used as negative controls. Not evaluated serum/motif combinations are indicated by empty dots. B) Box-and-whiskers charts of reactivity values of true positive and negative sera (expressed as % of a reference serum) for each antigenic motif and controls. The level of statistical significance (* and p-values) of Mann-Whitney non parametric test are indicated. C) Column chart showing % sensitivity (red columns) and specificity (green columns) for each prioritized motif and controls. D) Correlation analysis of ELISA (red columns) and Chagas-chip (green columns) reactivity. Pearson´s r coefficient (parametric), p-value and Spearman’s r coefficient (non- parametric) are indicated.

