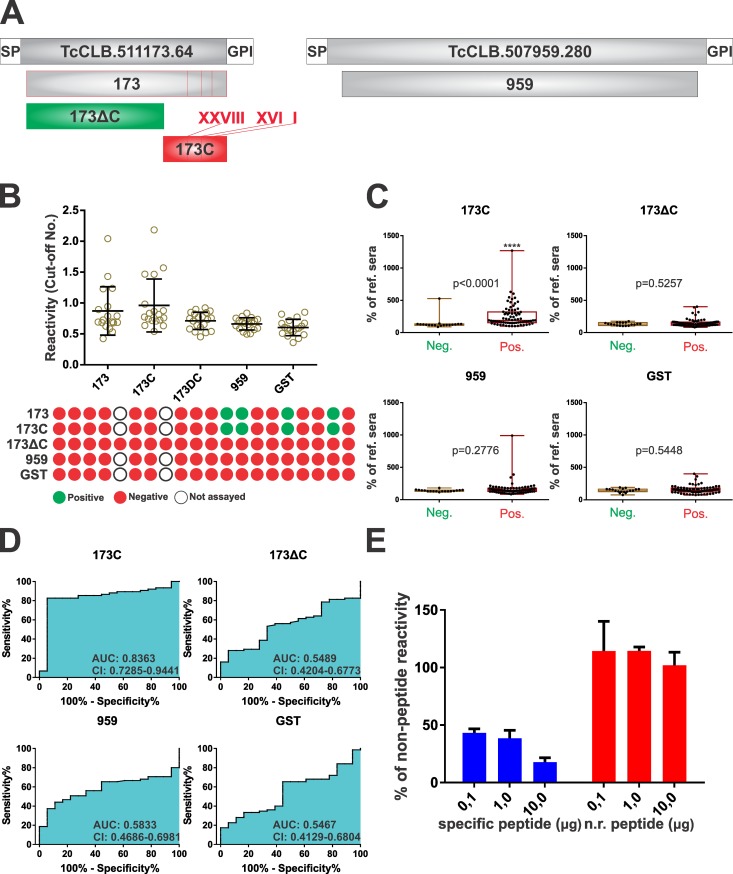
Fig 6. Prioritized antigenic motifs drive MASP reactivity.
A) Schematic representation of GST- fusion constructs (green) derived upon MASP TcCLB.511173.64 (173, 173C and 173ΔC) or TcCLB.507959.280 (959) generated to perform validation assays. Antigenic motifs (1, 16 and 28) are indicated as red lines within 173 and 173C. B) Relative reactivity (left) and one-to-one schematic profiling (right) of Chagasic sera (n = 20) against each GST-fusion protein is indicated as in legend to Fig 5. C) Box-and-whiskers charts of reactivity values of true positive and negative sera (expressed as % of a reference serum) for the indicated GST-fusion proteins. The level of statistical significance (* and p-values) of Mann-Whitney non parametric test are indicated. D) ROC curves (%Sensitivity vs. 100%- %Specificity) analysis of 173 recombinant constructs and controls. The area under the curve (AUC) and the 95% confidence interval (C.I.) are indicated. E) Reactivity values (expressed as the % of reactivity of PBS-added sera) of a Chagasic serum reactive against the GST-fusion protein spanning motif 2 treated with increasing amounts (0.1, 1.0 or 10 μg) of the specific (motif 2 peptide) or non-related (‘scrambled’) peptides.

