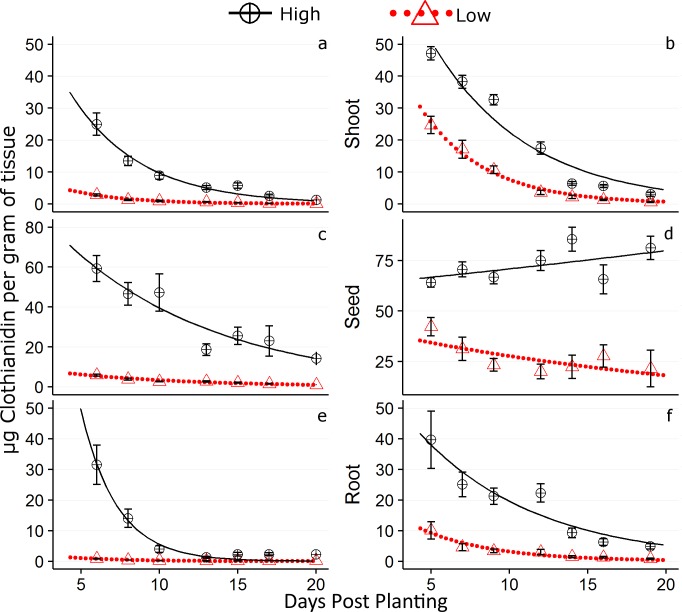
Fig 5. Values of μg clothianidin per g of plant tissue with standard error bars.
The 2014 data are represented by graphs (a), (c), and (e), and 2015 data by graphs (b), (d), and (f). The first 20 days post planting (DPP) are shown. Concentrations as predicted by the first order exponential decay equation are represented by a dotted red line and solid black line for the respective 0.25 and 1.25 mg /clothianidin application rates.

