
Figure 1. Deconvolution analysis.
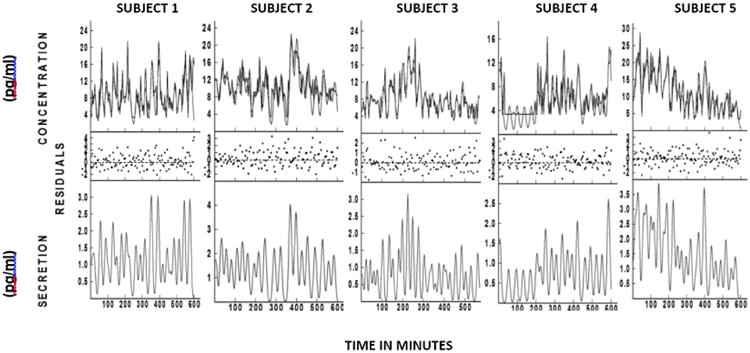
The top panel depicts the absolute concentration of OXT over time for each of the subjects. The middle panel represents the residuals. The bottom panel depicts secretory bursts of OXT for the same period of time. The Y axis represents the magnitude of the secretory bursts (pg/ml) and the X axis represents time in minutes.