Figure 1.

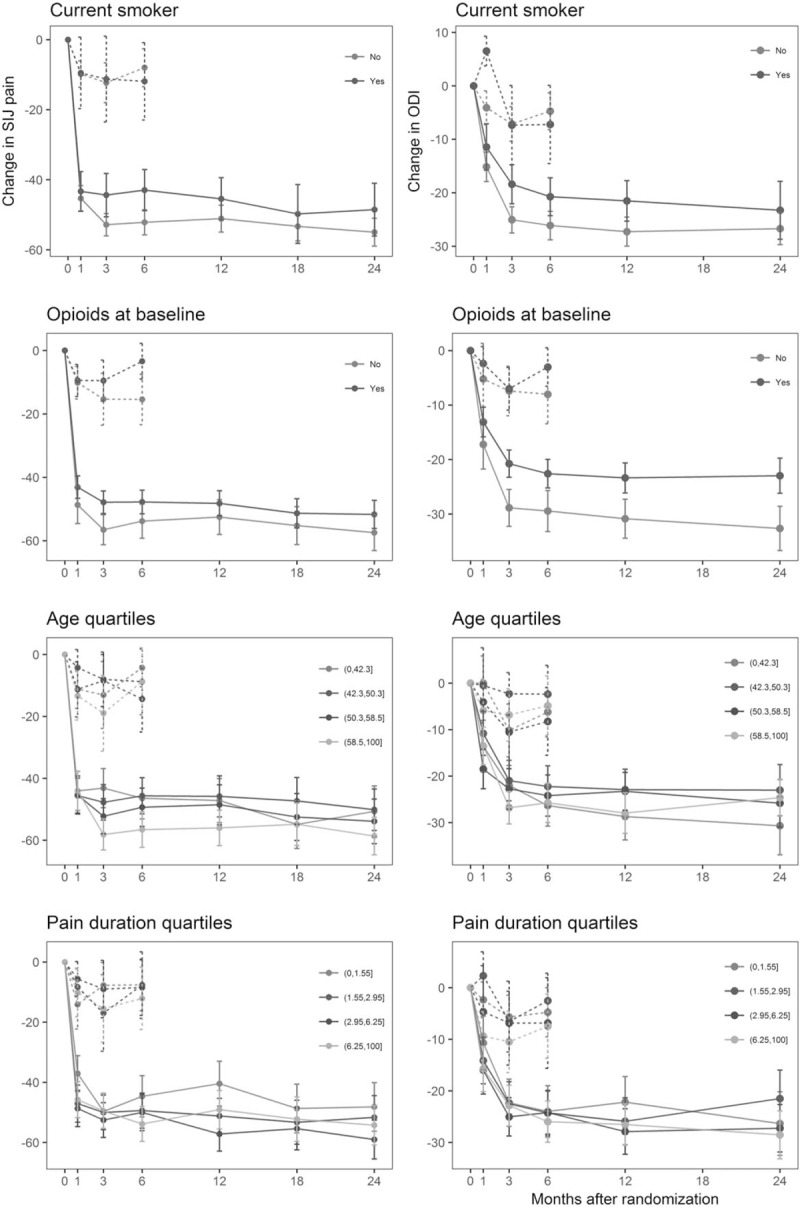
Changes in pain (by VAS, left) and disability (by ODI, right) over time for NSM (dotted lines) and SIJF (solid lines) in relation to baseline smoking, opioid use, patient age, and pain duration.

Changes in pain (by VAS, left) and disability (by ODI, right) over time for NSM (dotted lines) and SIJF (solid lines) in relation to baseline smoking, opioid use, patient age, and pain duration.