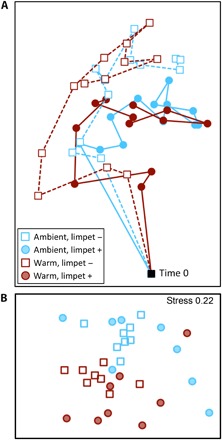
Fig. 2. Effect of limpet herbivory and warming on change in community composition over time.

(A) nMDS plot of successional trajectories over 16 months. Each point on the nMDS plot represents the average community composition of that treatment at that time. The distance between data points in the ordination represents the change in composition between time points. The black square represents the start of the experiment (empty plates on 3 May 2011). See table S5 for correlations of taxa abundances with nMDS axes. (B) Second-stage analysis showing the variation in successional trajectory within and among treatments. Warming modified the effect of limpets on community trajectory (PERMANOVA: warming × limpet F1,28 = 2.34, P = 0.023). Each point represents the trajectory for each plate, specifically, the correlation structure between time points for a single plate that are independent of the identity of taxa. Differences between points show whether the trajectory over time was similar or variable among replicates (n = 8) for each treatment. Complete analyses can be found in table S4.
