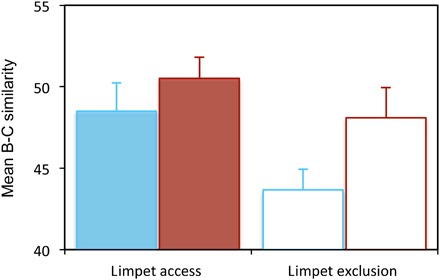
Fig. 3. Mean compositional turnover.

(±SE, n = 8), measured as the Bray-Curtis (B-C) similarity in the cover of all taxa, between pairwise sampling events on individual settlement plates (analysis of variance (ANOVA): warming F1,28 = 4.32, P = 0.047; limpets F1,28 = 5.51, P = 0.026; warming × limpet F1,28 = 0.61, P = 0.441). Colors are the same as in Fig. 1.
