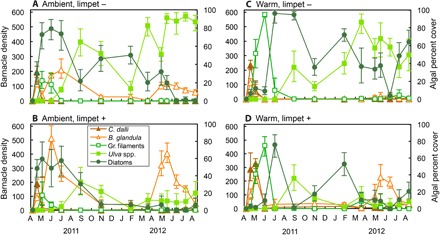
Fig. 4. Variation in population abundances.

Mean abundance (±SE) of key taxa over time in each treatment: (A) ambient, limpet exclusion (−), (B) ambient, limpet-accessible (+), (C) warm, limpet exclusion (−), and (D) warm, limpet-accessible (+). All species contributing to the similarities of community composition (table S5) are displayed. Barnacle (B. glandula and Chthalamus dalli) density is displayed on the primary y axis, and percent cover of algal species (green filaments, Ulva spp., and benthic diatoms) is displayed on the secondary y axis. Results from repeated-measures ANOVA (RM-ANOVA) for each taxa can be found in table S2.
