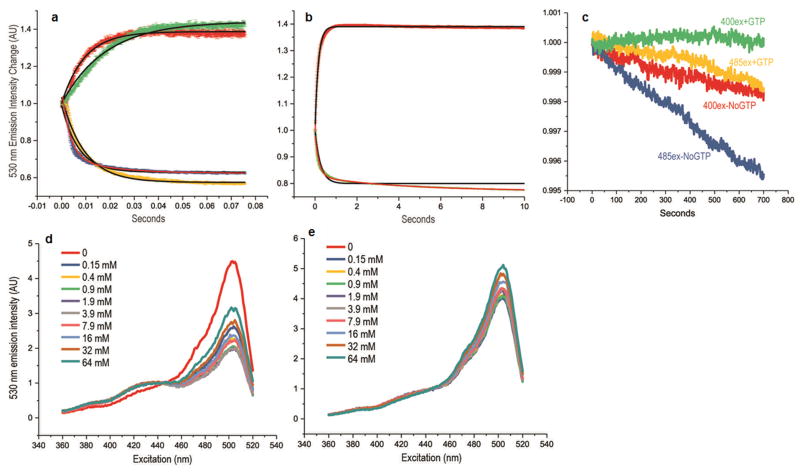
Figure 2. Kinetics and Mg++ dependence of GTP induced fluorescence changes.
(a) Emission intensity (530 nm) upon excitation at 400nm (red and green traces) or 485nm (blue and yellow traces) vs. time for reactions in which GTP-free FY5a+5a fusion was reacted with 100 (green and yellow) or 500 (red and blue) μM GTP. Initial fluorescent intensities normalized to a value of 1.0. Trace thickness shows +/-SEM for n=4. Black lines show fits to single-phase exponential association (red and green traces) or exponential decay (blue and yellow traces) functions. The high GTP concentration 485ex data (blue trace) was not well-fit by a single-phase exponential so a fit with a double-phase exponential decay function (red line) is also shown. (b) Fluorescence emission intensity (530nm) upon excitation at 400nm (green trace) or 485nm (red trace) vs. time for reactions in which FY5a+5a with 100μM GTP was reacted with 2.5mM GDP. As in panel (a), the black lines show single-phase exponential fits while the red line shows a double-phase fit. While it's unclear why the data do not always obey single-phase exponential functions, they do show that the fluorescent responses are fast, occurring with half-lives of ∼10 and ∼100msec in response to, respectively, increases or decreases in GTP concentrations. (c) Fluorescent emission intensity (530nm) vs. excitation for FY5a+5a continuously illuminated at either 400nm (green and red traces) or 485nm (yellow and blue traces) either with (green and yellow traces) or without (red and blue traces) GTP. Initial intensity is normalized to 1.0 for all traces. Emission intensity decreases (bleaching) are all <0.5% over more than hour of constant excitation. (d) Fluorescent emission intensity (530nm) vs. excitation wavelength for FY5A+5A with 100μM GTP. Reactions contained 0. mM EDTA and either 0 (red trace), 0.25mM (dark blue), 0.5mM (yellow), 0.9mM (green), 1.9mM (purple), 3.9mM (grey), 7.9mM (pink), 16mM (light blue), 32mM (brown), or 64mM (dark green) Mg++ (Mg++ concentrations specified in the figure are expressed to 2 significant figures and correspond to free Mg++ concentrations due to chelation by EDTA). (e) As in (d) but with GTP-free FY5a+5a fusion.

