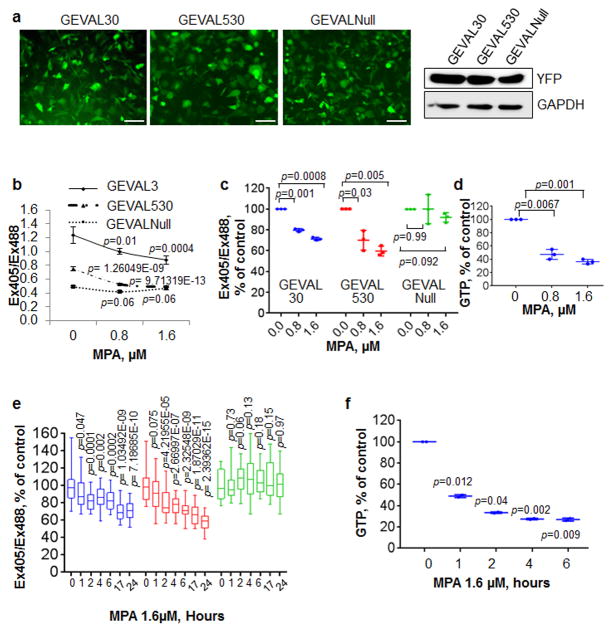
Figure 3. Validation of the GEVAL sensors GTP-sensing activity in mammalian cells.
(a) Human metastatic melanoma SK-Mel-103 cells were transduced with lentiviral supernatant to express GEVAL30, GEVAL530, and GEVALNull. The sensor expression was evaluated by both immunofluorescence and immunoblot to YFP (GAPDH was used to verify equal loading). Scale bar, 100μm. (b) Cells as in (a) were plated on coverslip chambers, treated for 48hrs with the indicated concentration of MPA, and imaged as described in Material and Methods. 30 cells/population were analyzed with ImageJ to calculate the Ex405/Ex488 ratio. The average -/+ SEM of the ratio for each condition within one experiment is reported. Statistics performed by two-tailed Student-t-Test. (c) Dot-plot of three independent experiments as in (b) normalized over the untreated control in each group; horizontal bars represent the average, vertical lines are standard deviation. Statistics performed by two-tailed Student-t-Test. (d) GTP quantification by HPLC measurement in SK-Mel-103 treated with the same concentrations of MPA as in (b and c). The data is express as the dot-plot of 3 independent experiments; horizontal bars represent the average, vertical lines are standard deviation. Statistics performed by two-tailed Student-t-Test. (e) Populations of SK-Mel-103 cells as in (b,c) were imaged (0h) and then treated with 1.6μM MPA and imaged at the indicated time points. Bar and whisker plots of 30 cells from two independent experiments normalized over the untreated control (0h) in each group; horizontal bars represent the average, whiskers represent minimum and maximum values, boxes represent the 1st and 3rd quartiles. Statistics performed by two-tailed Student-t-Test. (f) GTP quantification by HPLC measurement in SK-Mel-103 treated with 1.6μM MPA for the indicated time-points. The data is expressed as the dot-plot of 2 independent experiments; horizontal bars represent the average, vertical lines are standard deviation. Statistics performed by two-tailed Student-t-Test.

