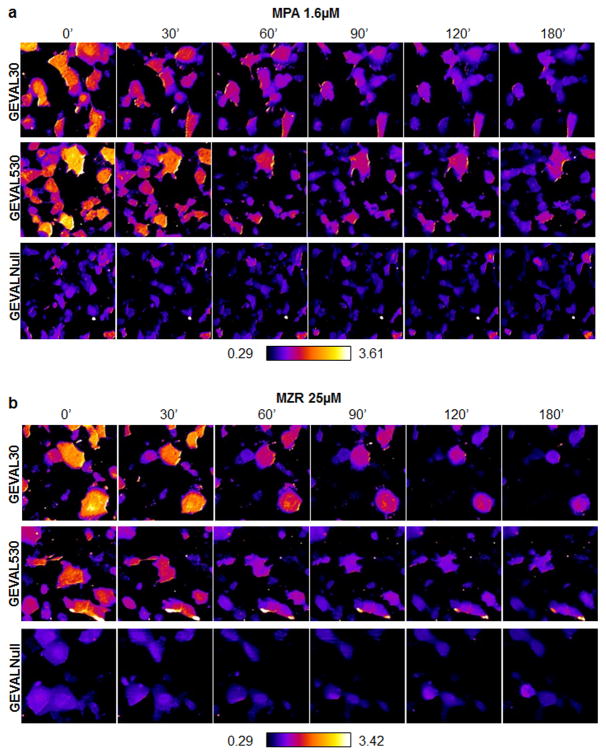
Figure 4. Detection of spatio-temporal variations of GTP in cells.
SK-Mel-103 cells were transduced with lentiviral supernatant to express the GEVAL30, GEVAL530, or GEVALNull. Cells were plated on coverslip chambers and imaged with a Leica AOBS SP5 confocal microscope as described above (0h). Cells were then treated with 1.6μM MPA and imaged at the indicated time points. Pixel-by-pixel ratiometric images were generated within ImageJ with the RatioPlus Plugin for each time point. All the ratios were then combined in a stack to ensure a uniform application of contrast enhancement and false-coloring (with the FIRE_LUT). (a) Representative ratiometric images of cell populations for each sensor over time. (b) Cells as in (a) but treated with 25μM MZR. Quantification of Ex405/Ex488 in 10 cells/population over time for cells treated as above is presented in Supplementary Fig. S11d,e.

