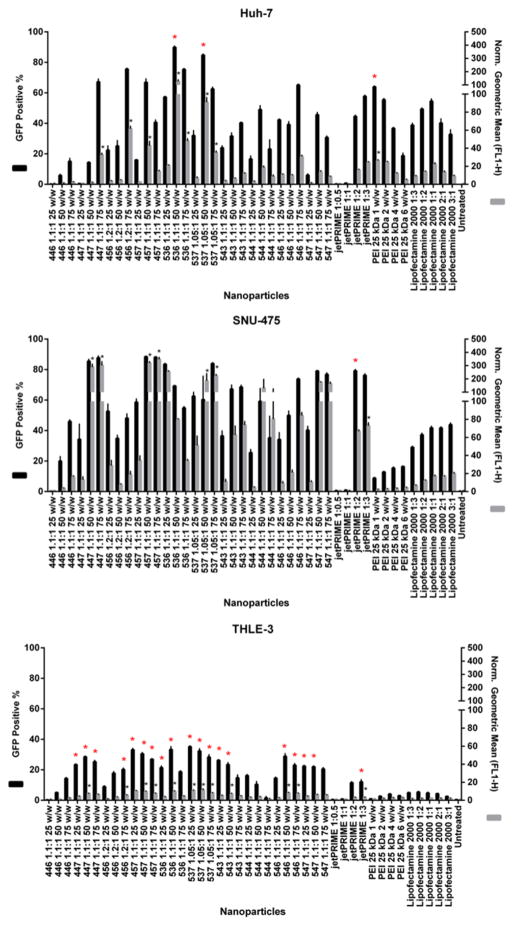
Fig. 3.
Transfection efficacy screen of all PBAE and positive control NPs to A. Two representatives of HCC cell lines and the THLE-3 hepatocytes. EGFP expression was measured using flow cytometry 48 hours after transfection and analyzed for the percentage (positive %) and intensity (geometric mean) of GFP expression. Geometric mean results from each condition are relative to untreated controls. Norm.: Normalized. * P < 0.05 for statistically significant differences between PBAE polymers with superior transfection efficacy and the most effective among positive controls for each cell line.

