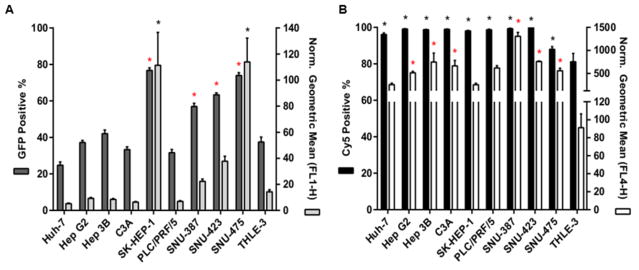
Fig. 5.
A. Levels of eGFP expression following electroporation for HCC cells and hepatocytes. B. Cy5 signal from all nine cancer cell populations and THLE-3 hepatocytes showing cellular uptake of 536 NPs. * P < 0.05 for statistically significant differences between hepatocytes and each individual HCC line.

