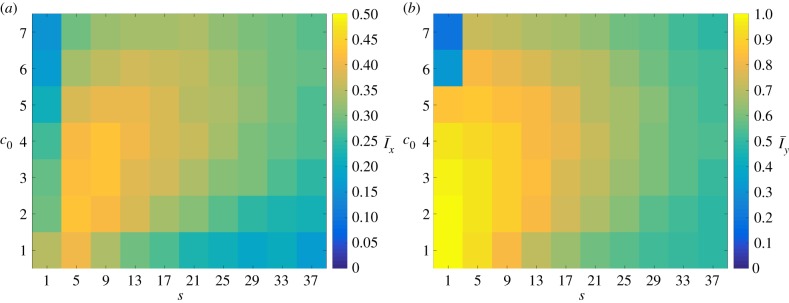
Figure 14.
The mean values (a)  and (b)
  of the indices from 50 iterations of simulated unbiased growth (
 ) on a domain with Lx = Ly = 100 with Lx = Ly = 100 and ongoing nutrient consumption. Ongoing nutrient consumption shifts the values of the indices but does not introduce new growth patterns. (Online version in colour.)

