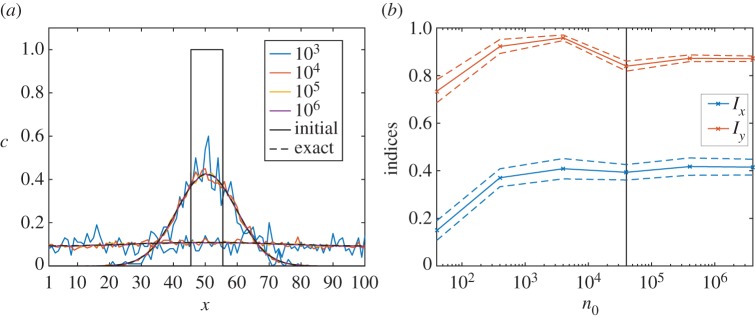
Figure 5.
(a) Solutions to the example diffusion problem at times 20 and 400, along with the initial condition. As the number of packets n0 increases, the averaged simulation data approach the continuum solution. The data corresponding to 106 packets are indistinguishable from the continuum solution to graphical accuracy. (b) The indices Ix and Iy plotted against n0 for 50 iterations of unbiased growth with s = 2 and m0 = 4 × 10⁴ computed until ρ = 0.5. The horizontal axis is plotted on a logarithmic scale. The black vertical line marks the point at which m0 = n0. The mean indices are approximately constant for n0 ≥ m0.

