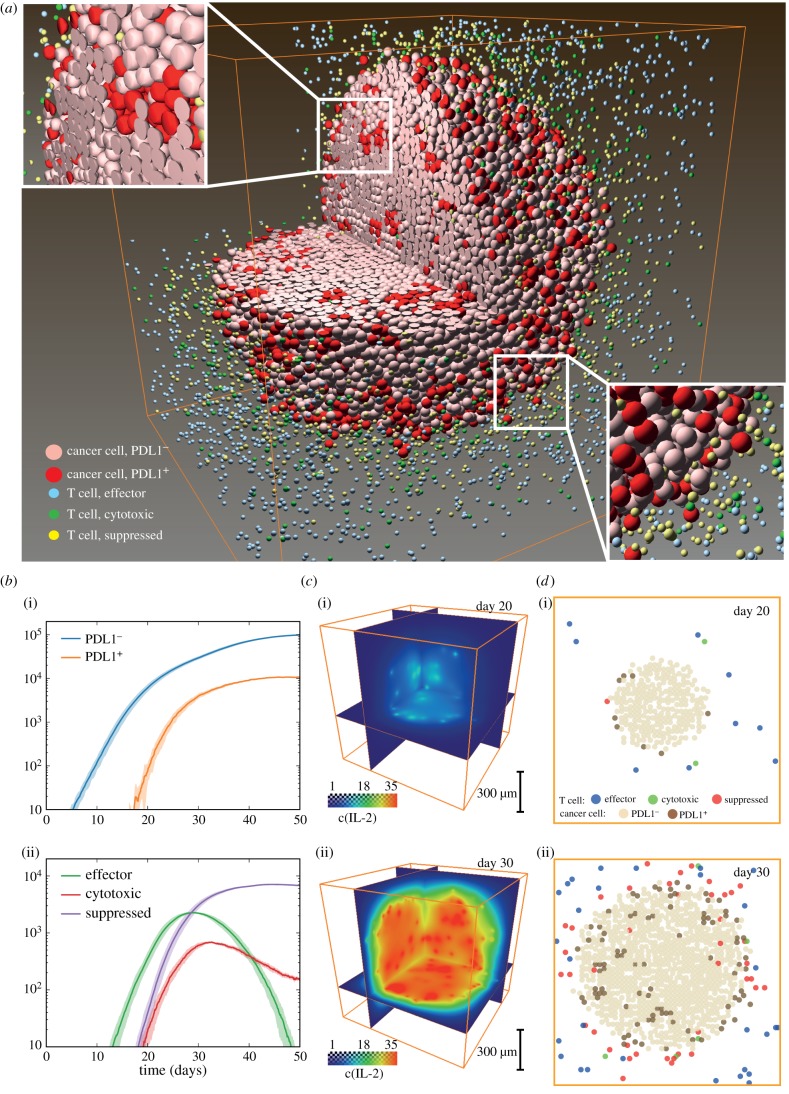
Figure 2.
Tumour development baseline. (a) Three-dimensional distribution of different cell subsets. Insets show relative locations of T cells and cancer cells in the interior and at the tumour boundary. (b) Time courses of cancer and T-cell statistics tracked during simulation. (i) PDL1+ and PDL1− cancer cell counts. Shadow indicates ± standard deviation. (ii) Effector, cytotoxic and suppressed T-cell counts. Shadow indicates ± standard deviation. (c) Distribution of IL-2 concentration on days (i) 20 and (ii) 30. (d) Slices of simulated tumour at days (i) 20 and (ii) 30, showing distribution of different cell types. Orange box is simulated space of 1 mm edge lengths.

