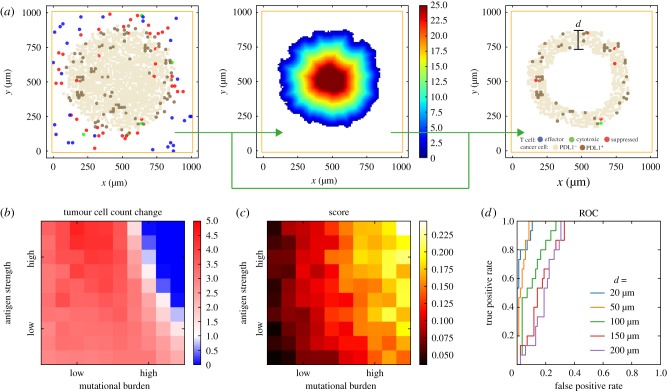
Figure 6.
Regionalization and scoring simulated tumour. (a) Tumour boundary is detected from spatial distribution of cells from simulation, and a Euclidian distance map is calculated for the distance to surface from every point inside the tumour. Sub-regions can be selected by thresholding the distance of interest (100 µm is used in this example). Regionalized PDL1 score as a potential biomarker for anti-PD1 treatment. (b) Simulated treatment outcome. Colour indicates reduction in total cancer cell count at day 50 with anti-PDL1 treatment versus day 30 (pretreatment). (c) Score obtained by regionalizing tumour, calculated as the fraction of PDL1+ cancer cells within the rim of designated thickness. 50 μm distance cut-off is used in this figure. (d) ROC curves of different cutoff distances.

