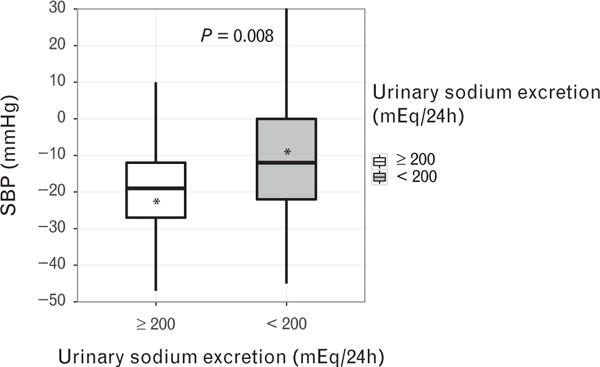
FIGURE 1.

Box plot showing SBP reduction in resistant hypertension patients with urinary sodium excretion at least 200 and less than 200 mEq/24 h. The asterisk denotes the mean; the line inside the box depicts the median; the upper and lower hinges represent 25th and 75th percentile, respectively.
