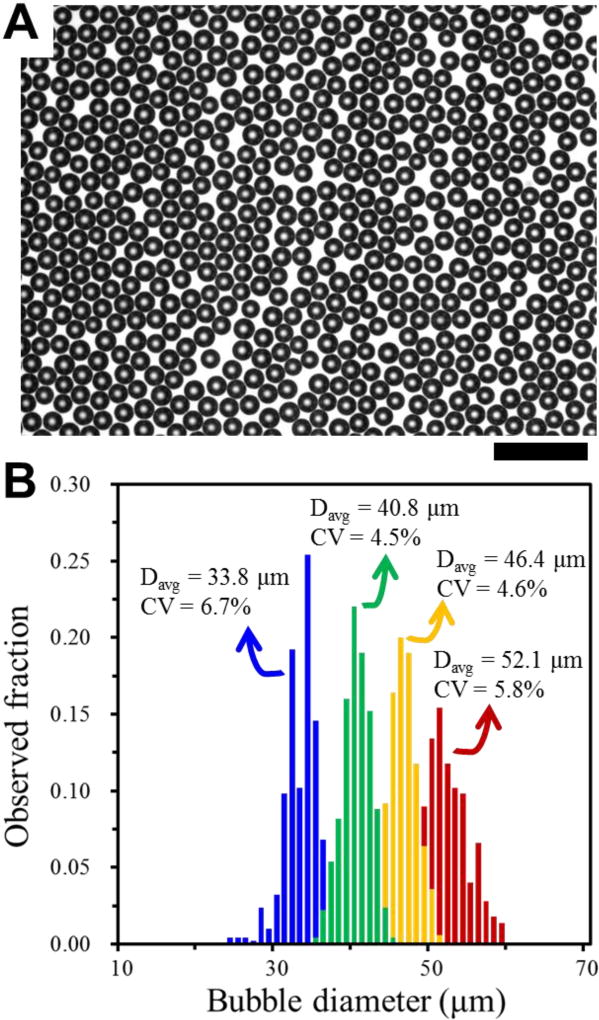
Fig. 4.
(A) Optical microscopy image of gas bubbles produced using 3D MED-400 III. Scale bar indicates 200 µm. (B) Size distribution of gas bubbles generated in the optimal range of gas pressure. Blue, green, yellow and green histograms represent the size distributions of gas bubbles generated with gas pressures of 0.138, 0.151, 0.165, 0.179 mPa, respectively.

