
Figure 3.
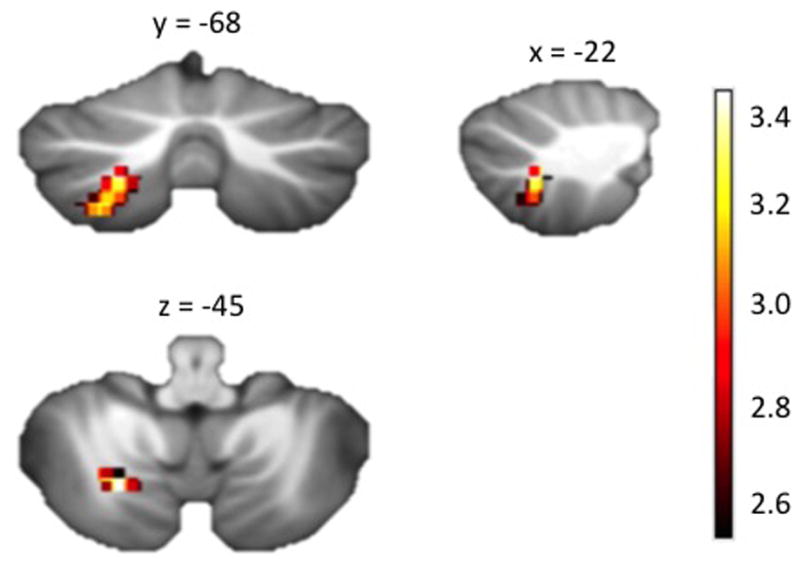
A statistical parametric map from the SUIT cerebellar-specific, voxel-based morphometry analysis illustrating voxels exhibiting a significant negative correlation with ‘p factor’ scores within the left cerebellar lobule VIIb (x = −22 y = −68 z = −45). This association was independent of age, sex, and intracranial volume. Colorbar reflects t scores.