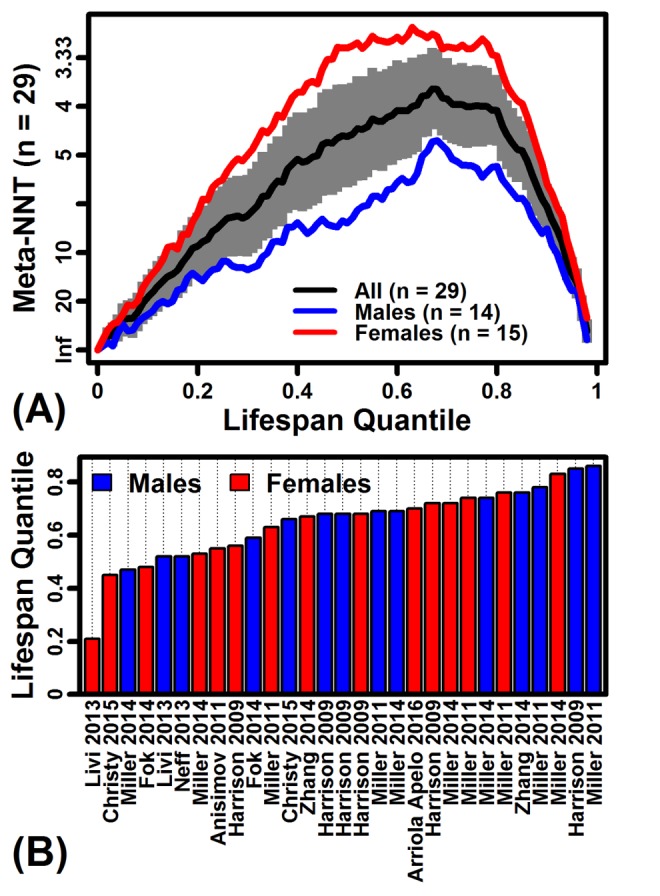
Figure 1. Number needed to treat (NNT) estimates from rapamycin-treated mouse cohorts.

(A) NNT meta-estimates across lifespan quantiles (n = 29 survivorship experiments). Survival times in each experiment were converted to quantiles to permit integration across experiments. Absolute risk reductions (ARR) were calculated with respect to each lifespan quantile in each experiment, and then ARR estimates were integrated across studies using a random effects meta-analysis model [6]. The grey region denotes the 95% confidence interval associated with the NNT meta-estimate (black line). (B) Lifespan quantile associated with the minimum NNT estimate in each of 29 experiments. Horizontal axis labels are consistent with those used by Swindell [6].
