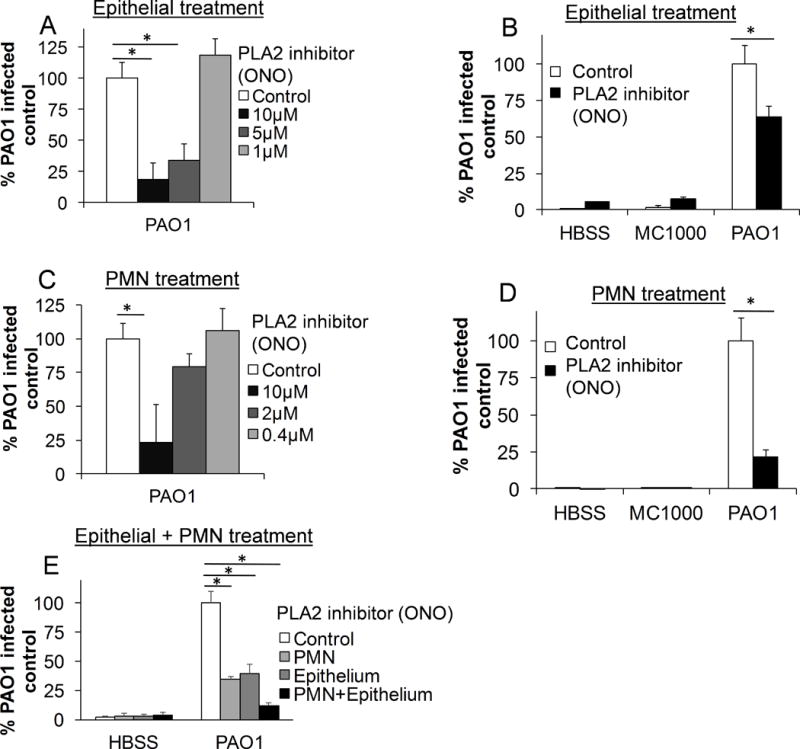
Figure 2. PLA2 activity is required in both the epithelium and the neutrophil for efficient neutrophil trans-epithelial migration in response to epithelial infection with PAO1.

A) H292 epithelial monolayers, grown on inverted Transwells, were pretreated with the pan-PLA2 inhibitor, ONO, at multiple doses, or vehicle control (DMSO 1:1000). Epithelial monolayers were then infected apically with the pathogenic P. aeruginosa strain, PAO1, washed, and untreated neutrophils were provided to the basolateral surface. B) H292 monolayers were pretreated with the PLA2 inhibitor ONO (10μM) or vehicle control (DMSO 1:1000). Monolayers were infected with either PAO1, a non-pathogenic strain of E. coli, MC1000, or mock-infection (HBSS). Untreated neutrophils were provided to the basolateral compartment. C) Healthy primary human neutrophils were pretreated with multiple doses of the PLA2 inhibitor ONO or vehicle control (DMSO 1:1000) for 30 min. Untreated H292 epithelial monolayers were infected with PAO1, washed, and treated neutrophils were provided to the basolateral compartment. D) Neutrophils were pretreated for 30 min. with ONO (10μM) or vehicle control (DMSO 1:1000) and migrated in response to epithelial infection with PAO1, non-pathogenic MC1000, or mock infection (HBSS). E) Neutrophils and epithelial monolayers were treated for 30 min. and 2 hours, respectively, with ONO (10μM) separately or in combination, as above, prior to migration. For all experiments, relative neutrophil migration was assessed by myeloperoxidase activity in the apical compartment following 2h migration. Total myeloperoxidase activity was corrected for using standard curves generated for each drug treatment of neutrophil. Data are shown as mean corrected value +/− standard deviation. Experiments were performed on at least 3 occasions with n≥3 technical replicates. P values were calculated by ANOVA with Dunnett’s test (A, C, E) or paired Student’s t-test (B, D). P values ≤0.05 was consider statistically significant.
